
Dimensional Modeling: The 30-Year-Old Idea Every Modern Data Engineer Still Needs”
The architecture behind every great data stack proven, practical, and built to last.

1). “The irony of data: built for speed, stuck in traffic.”
“Data’s a trend-chaser. First a warehouse, then a lake, now a lakehouse. But behind the buzzwords, it’s always chasing the same thing: `CLARITY`.”
Data’s like that seasoned pro who’s seen every fad come and go, warehouse, lake, lakehouse, whatever’s next.
It doesn’t need a rebrand to stay relevant because it’s still solving the same timeless puzzle: making chaos make sense.
Humans, queries, entire companies still rely on it to turn raw noise into reason.
So , it’s old, but like vinyl or good coffee, that’s exactly why it never goes out of style.
2). The problem: today’s data chaos hiding inside modern warehouses.
“Modern context” in very easy words means how something fits or makes sense in today’s world, not in the past.
When we say “in the modern context,” it means we are looking at something based on how people live, think, and use new ideas and technology today. It’s about understanding how things fit in our present time, not how they were in the past.
Example:
In the past, very few women worked outside the home. But today, in the modern context, women have jobs and build careers. So society’s idea of women’s roles has changed to fit modern life.
Cloud warehouses made data cheap and fast → so people just started to dump everything in them.
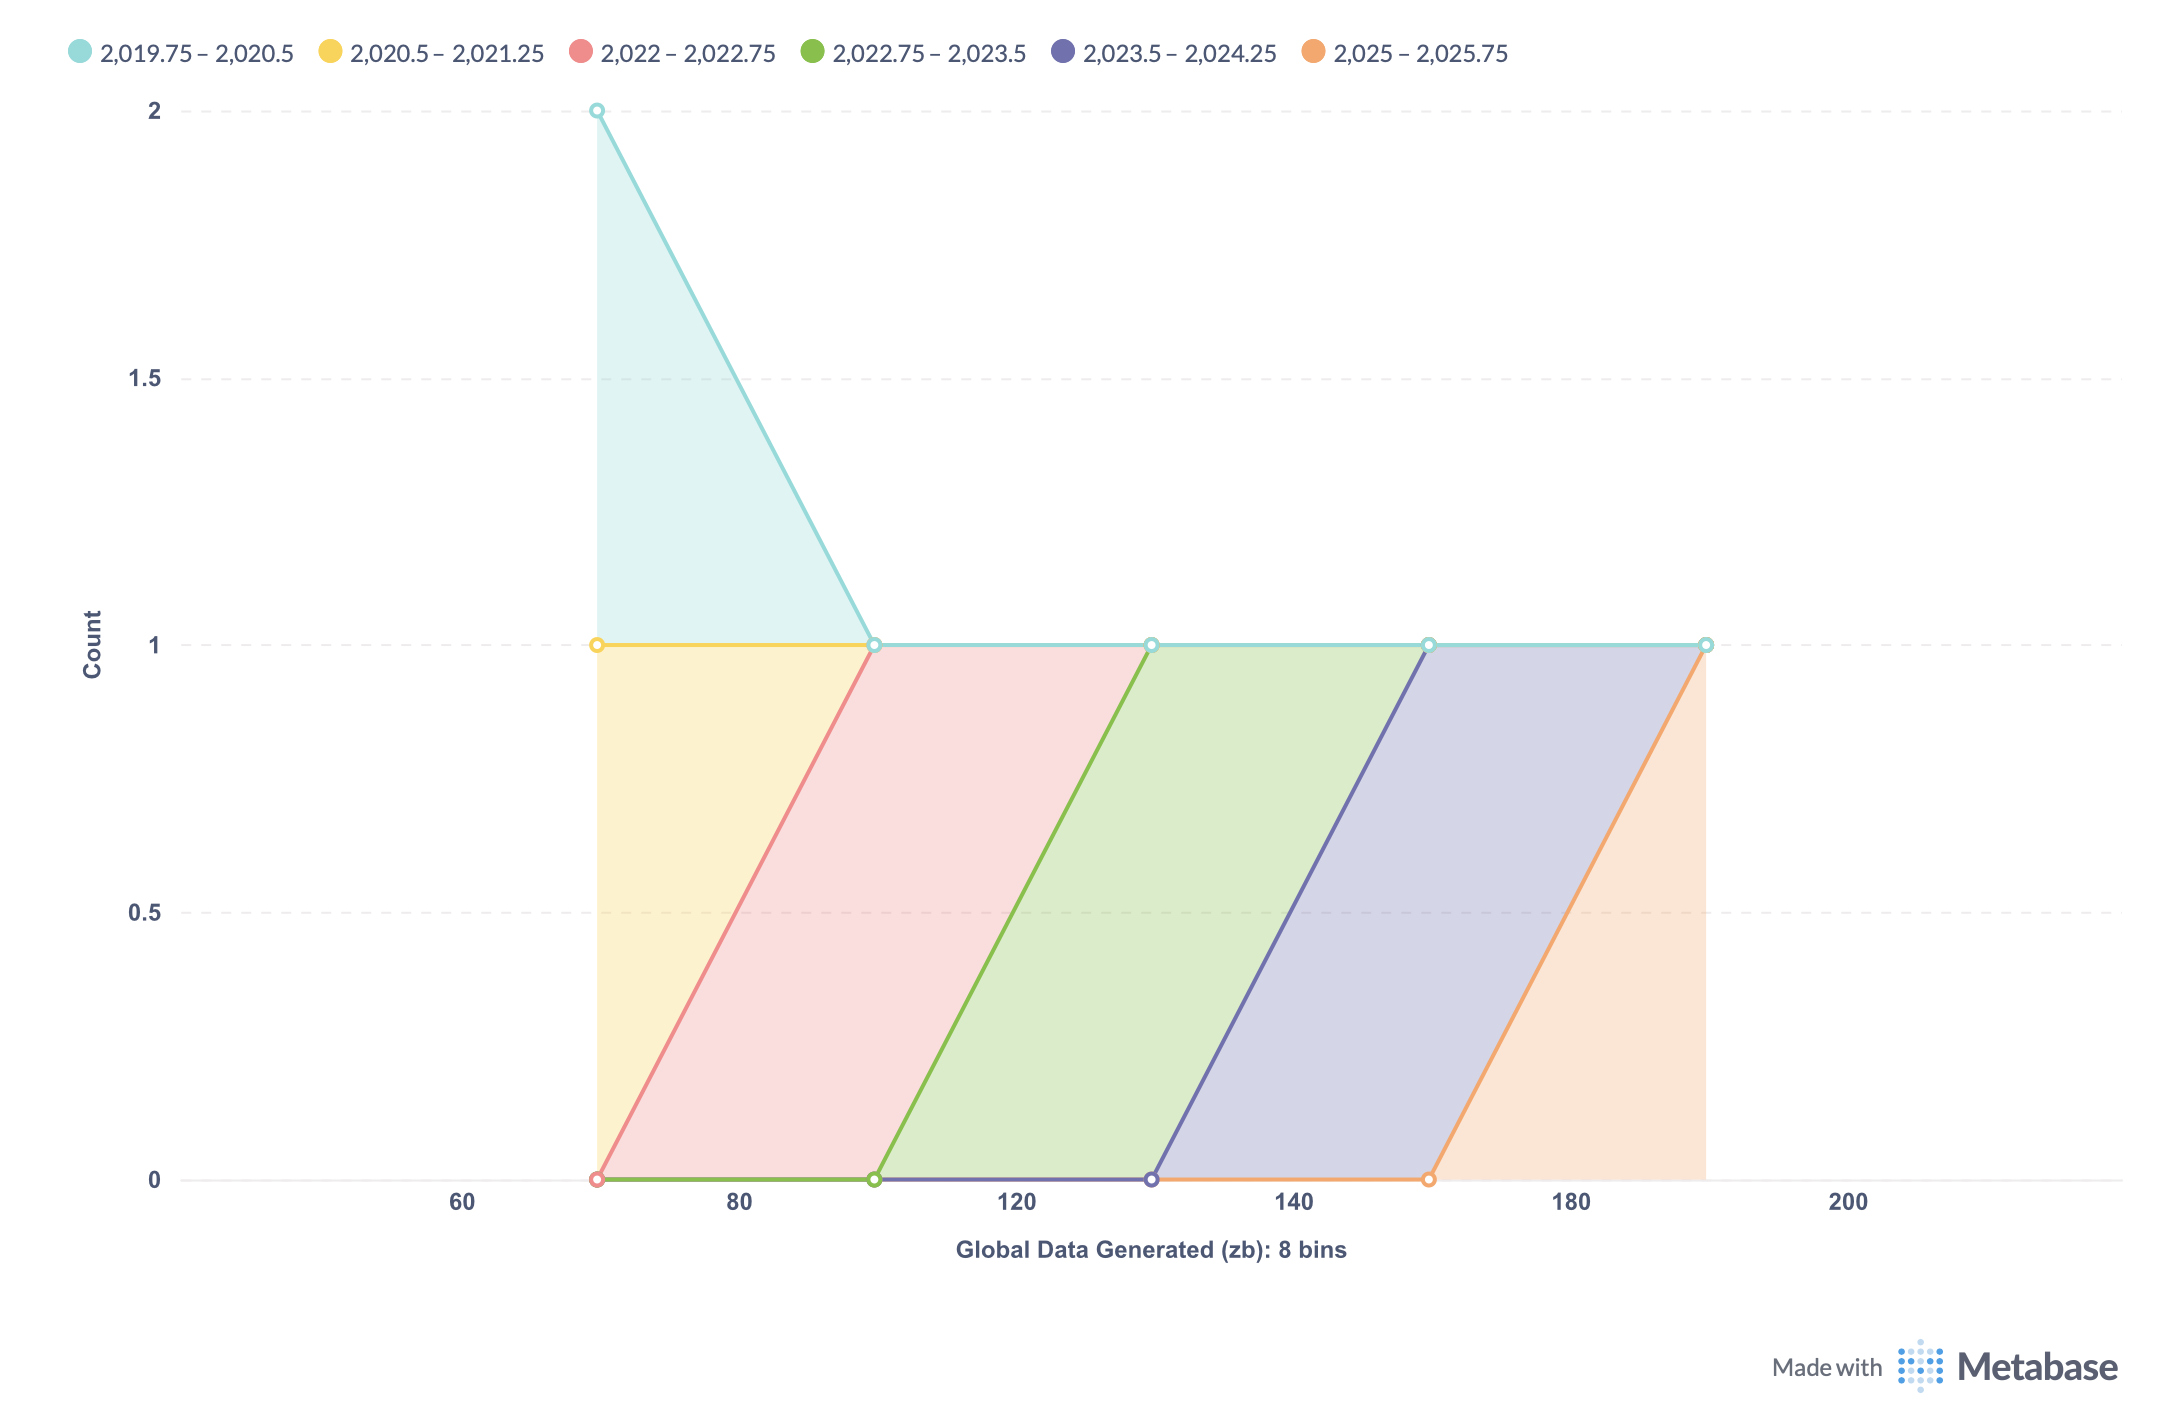
The magnitude of data has exploded ; especially after 2020.
In 2020, the world generated around 64.2 zettabytes of data that’s 64.2 trillion gigabytes. Since then, global data creation has surged exponentially, fueled by the rise of AI, IoT, remote work, and digital media. By 2025, projections from DemandSage and Seagate estimate total data generation will reach 181 zettabytes nearly three times what it was in 2020, growing at an average rate of 22–26% per year.
Cloud data warehouses made storing all this information cheap, fast, and scalable, leading many organizations to adopt a “dump everything” mindset pouring every dataset into the warehouse without much structure or strategy. While this worked at first, it quickly created chaos: hundreds of tables, unclear relationships, and multiple conflicting versions of key metrics like “revenue.”
Without proper cleaning, validation, or governance, data becomes cluttered, slow to query, and hard to trust.
It’s like blending all your groceries together and calling it dinner technically everything’s there, but nobody wants to touch it.
The result is data overload, slower performance, and unreliable insights proving that even in an age of infinite storage, organized data still wins.
Graphical representation:
Emphasize the pain:
Analysts don’t trust dashboards because the data behind them is messy or wrong, leading to incorrect insights.
Metrics don’t match across reports or tables, making it impossible to know which numbers are true.
Queries take forever to run since the system is overloaded with unorganized, duplicated, or conflicting data.
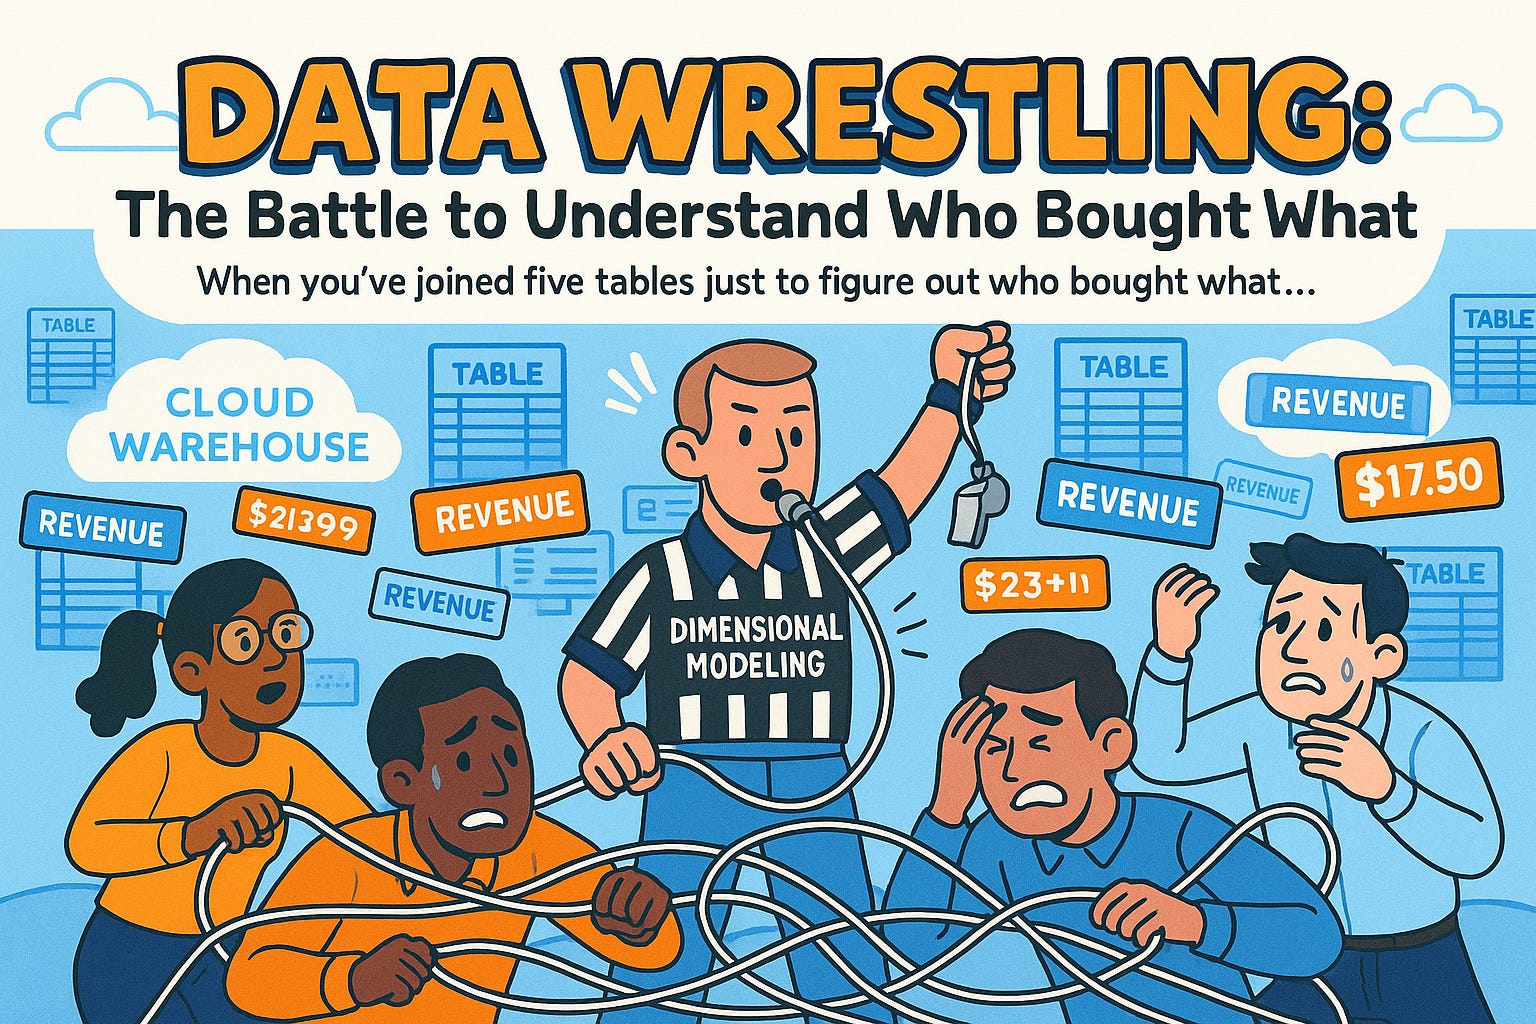
Humour:
“If you’ve ever joined five tables just to figure out who bought what, welcome to the world of data wrestling , where dimensional modeling is the referee that stops the chaos and declares a clear winner!”
3). The promise: A way to make data actually make sense.
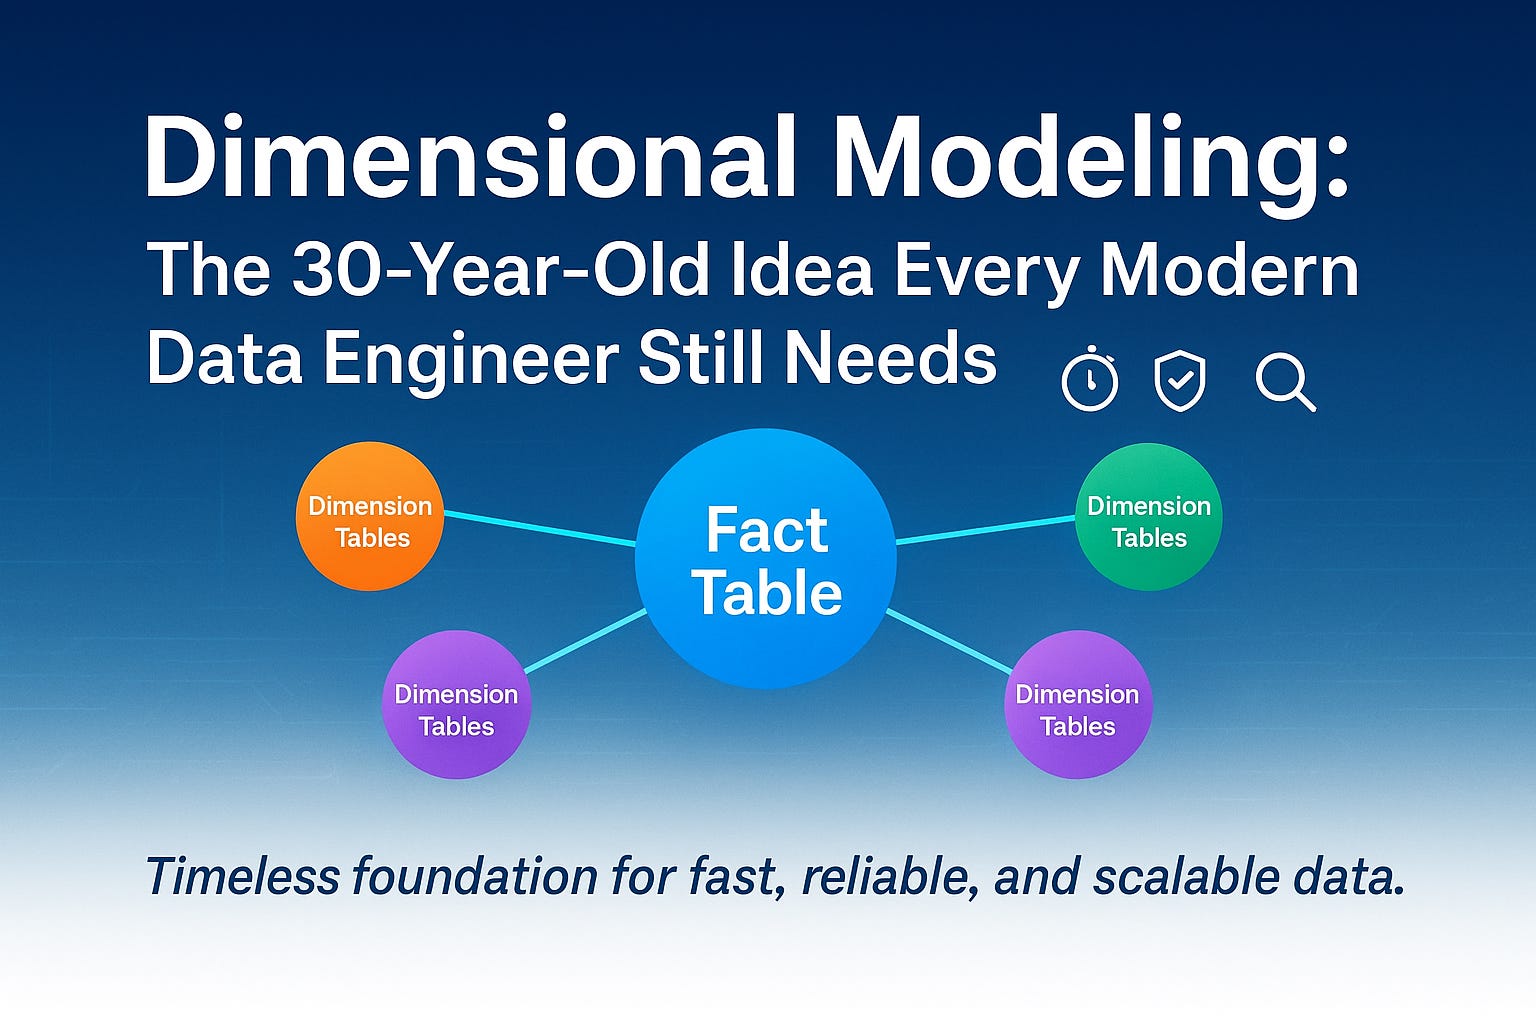
Dimensional modeling is the proven way to structure data so anyone, not just engineers, can navigate it confidently and get clear, reliable answers to real business questions.
It is based on two core ideas:
Facts: These are the important numbers or measurements in your business, like sales amount, number of units sold, or revenue. Facts represent what you want to measure or analyze.
Dimensions: These are the descriptive details or context about the facts, such as time (day, month, year), product (name, category), customer (age, location), or store. Dimensions help you answer questions like “When was it sold?” or “Who bought it?” or “Where was it sold?”
The fact tables hold the measurable data, while the dimension tables hold the descriptive information.
By organizing data into facts and dimensions, dimensional modeling improves data retrieval speed, clarity, and usability in data warehouses
Simple visual example student_attendence
Captures the measurable event: a student attending a class.
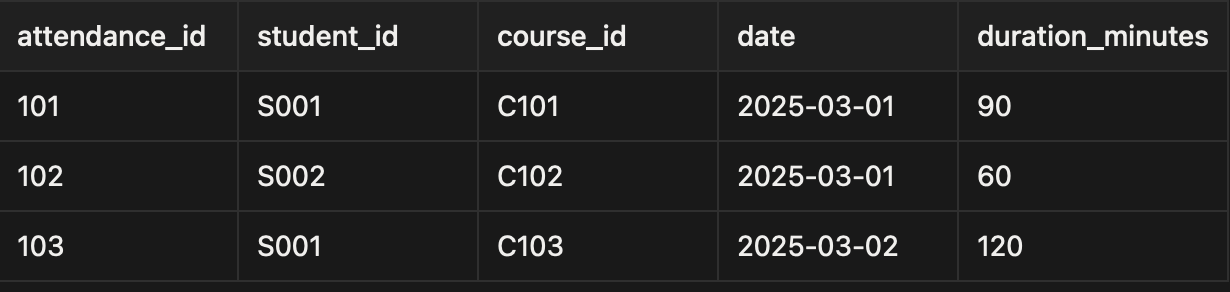
✅ Fact table = the event itself (who attended what, when, and for how long). It stores numeric or measurable data.
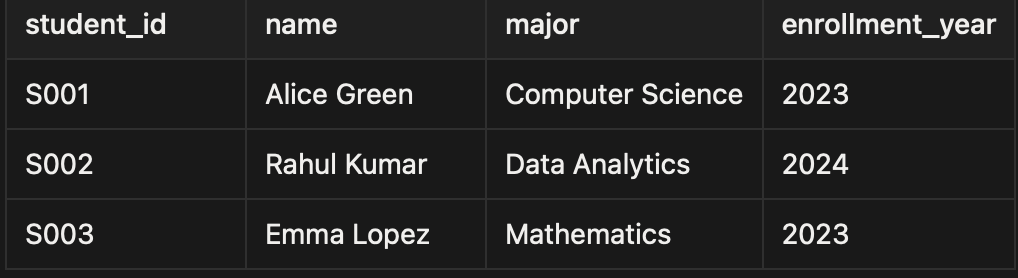
Dimension Table – students
Describes who attended.
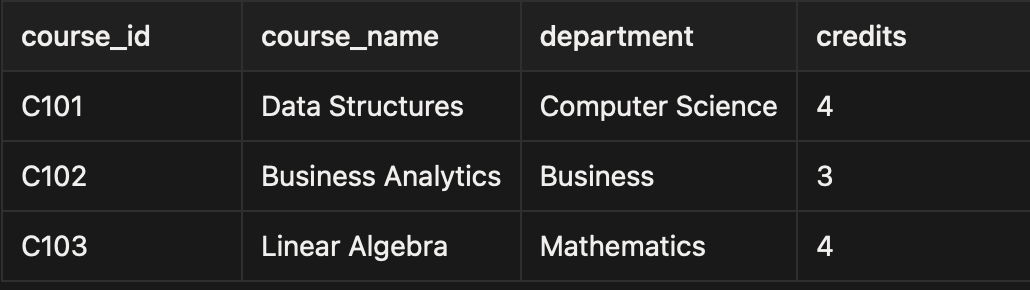
📚 Dimension Table – courses
Describes what they attended.
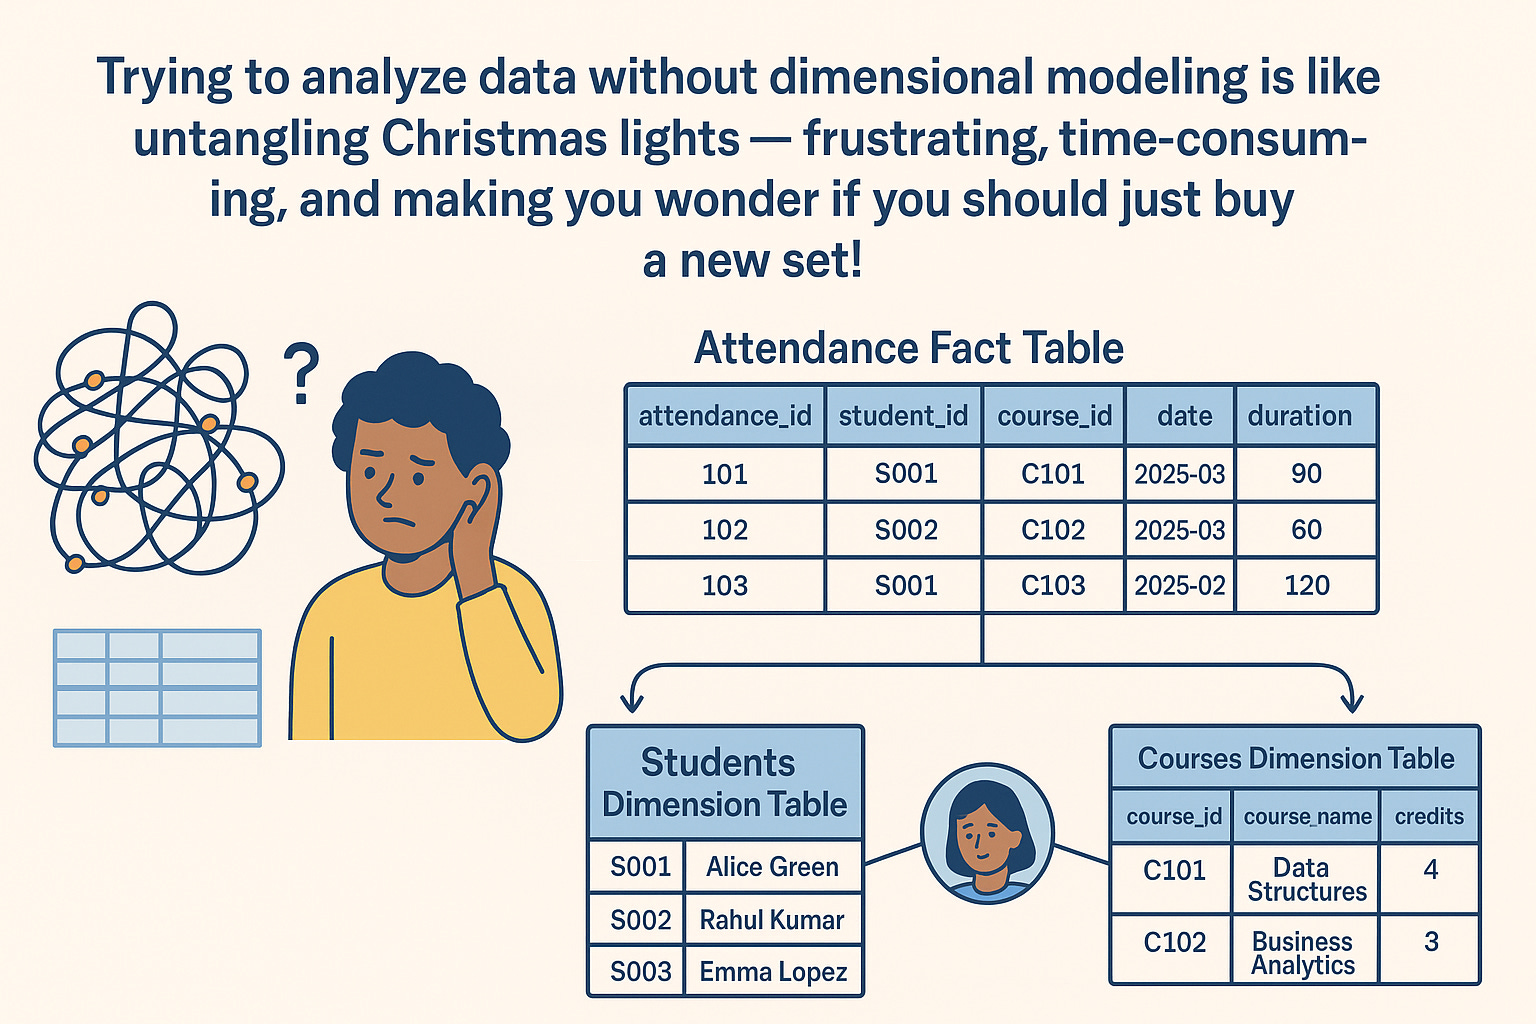
🔗 Relationships:
student_attendance.student_id→students.student_idstudent_attendance.course_id→courses.course_id
In simple terms:
Fact table = the measurable event (attendance).
Dimension tables = the descriptive context (who the student is, what course they attended).
“Trying to analyze data without dimensional modeling is like trying to untangle Christmas lights frustrating, time-consuming, and making you wonder if you should just buy a new set!”
4. “Why it still matters ; even in the age of dbt and the modern data stack”.
Because tools like dbt, Airflow, and the rest of the modern data stack are powerful , but they don’t replace the need for good modeling, they just automate and scale it.
Dimensional modeling still matters because:
Supports modern tools: dbt, metrics layers, and BI platforms still rely on a solid data model underneath to work effectively.
Scales with complexity: As data grows and evolves, a dimensional model keeps queries simple and performance predictable.
Timeless foundation: Technologies change, but the need for clarity, consistency, and context in analytics never does.
It’s the difference between following a clear path and getting lost without a clue where to go.
5. The myth: “Isn’t a data lake enough?”
“Sure, you can run analytics directly on raw JSON files in S3, if you’re okay with messy queries, slow results, and a lot of confusion every time you need an answer.”
Just storing all your data in one place (like a data lake in S3) doesn’t mean it’s ready to use. That’s like having all the ingredients for a cake but no recipe, the pieces are there, but they’re not useful yet.
Sure, you can run analytics directly on messy raw JSON files in S3, but you’ll end up with confusing queries, slow results, and numbers that don’t match from one dashboard to another.
That’s where modeling comes in. It’s the process of organizing and structuring your data so it’s clear, consistent, and easy to work with.
Once you model your data:
Metrics stay consistent — everyone agrees on what “active user” or “revenue” means.
Queries run faster — because the data is organized and optimized.
New people can understand the data quickly — because there’s a clear structure.
Key idea: Tools will always change, but the basic principle of organizing your data so humans (and machines) can understand it will never stop being important.
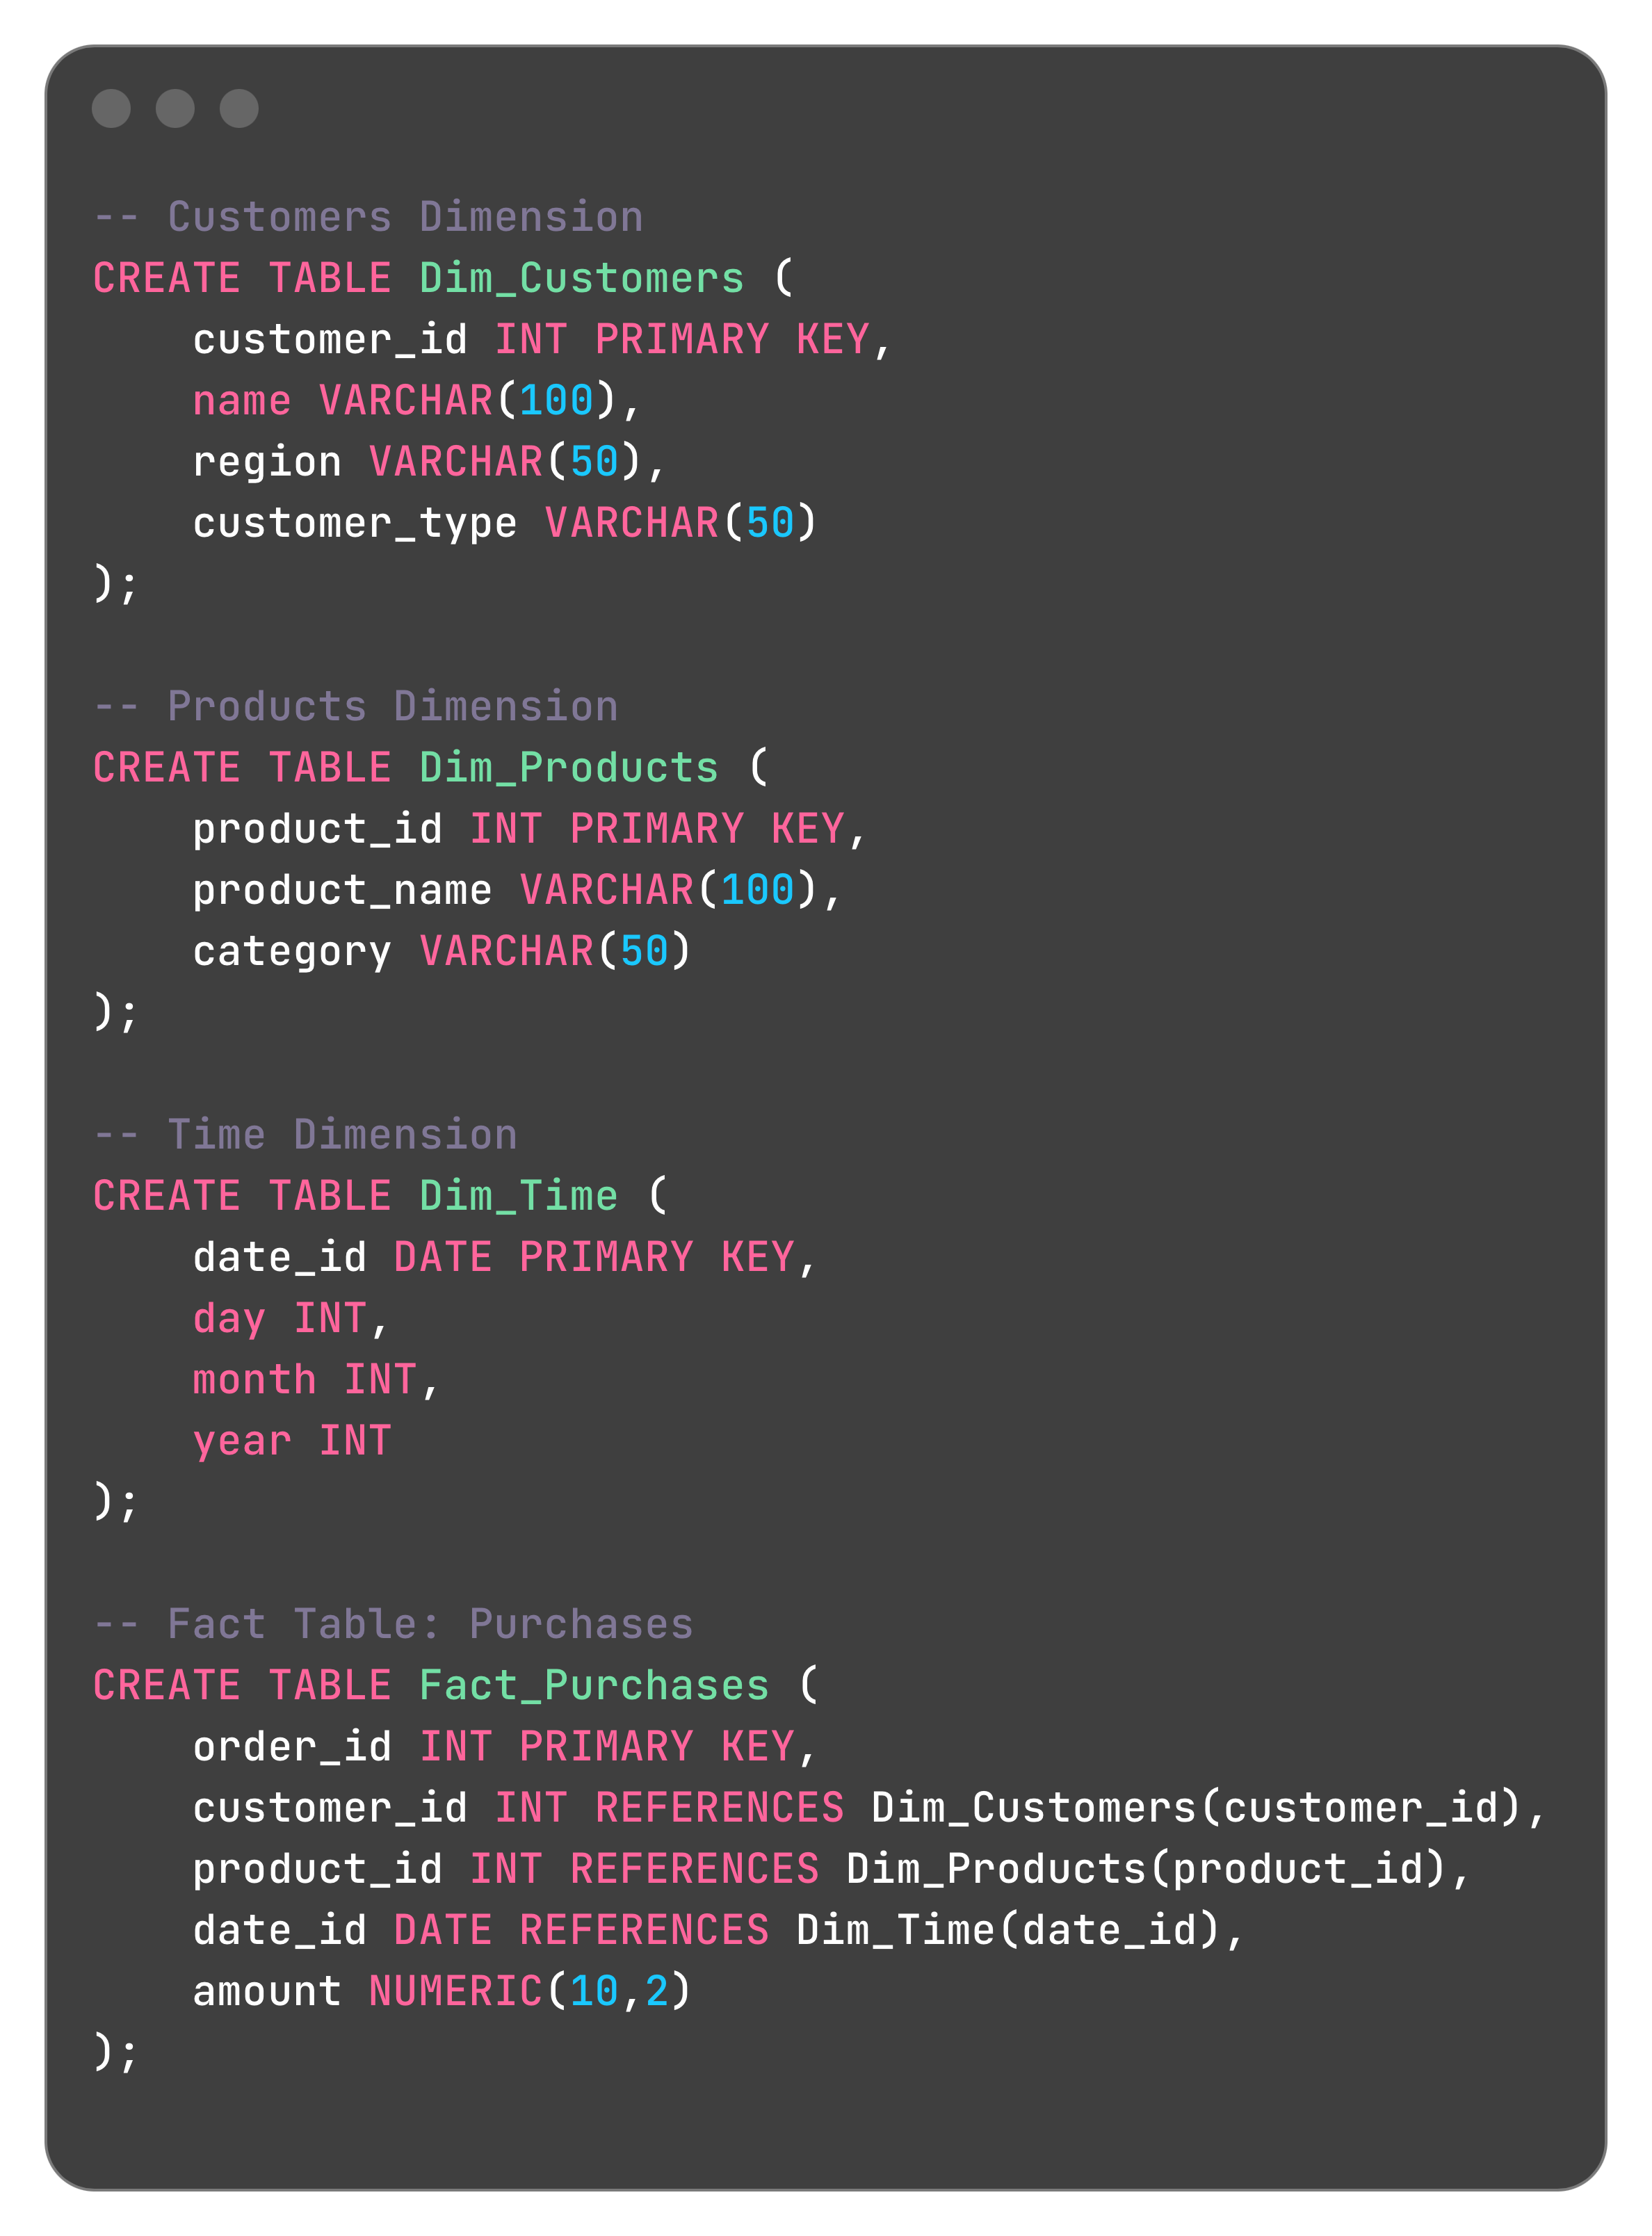
6. Example: online retail store
“Think of an online retail store managing thousands of daily orders. The fact table records each sale, what was sold, who bought it, where, and when. The dimension tables add meaning: products describe what was sold, customers tell who bought it, stores show where it happened, and time shows when. With this setup, the business can quickly ask questions like ‘Which region generated the most revenue this month?’ or ‘Which product categories are gaining popularity over time?
Step 1: Create Tables
Step 2: Insert Sample Data
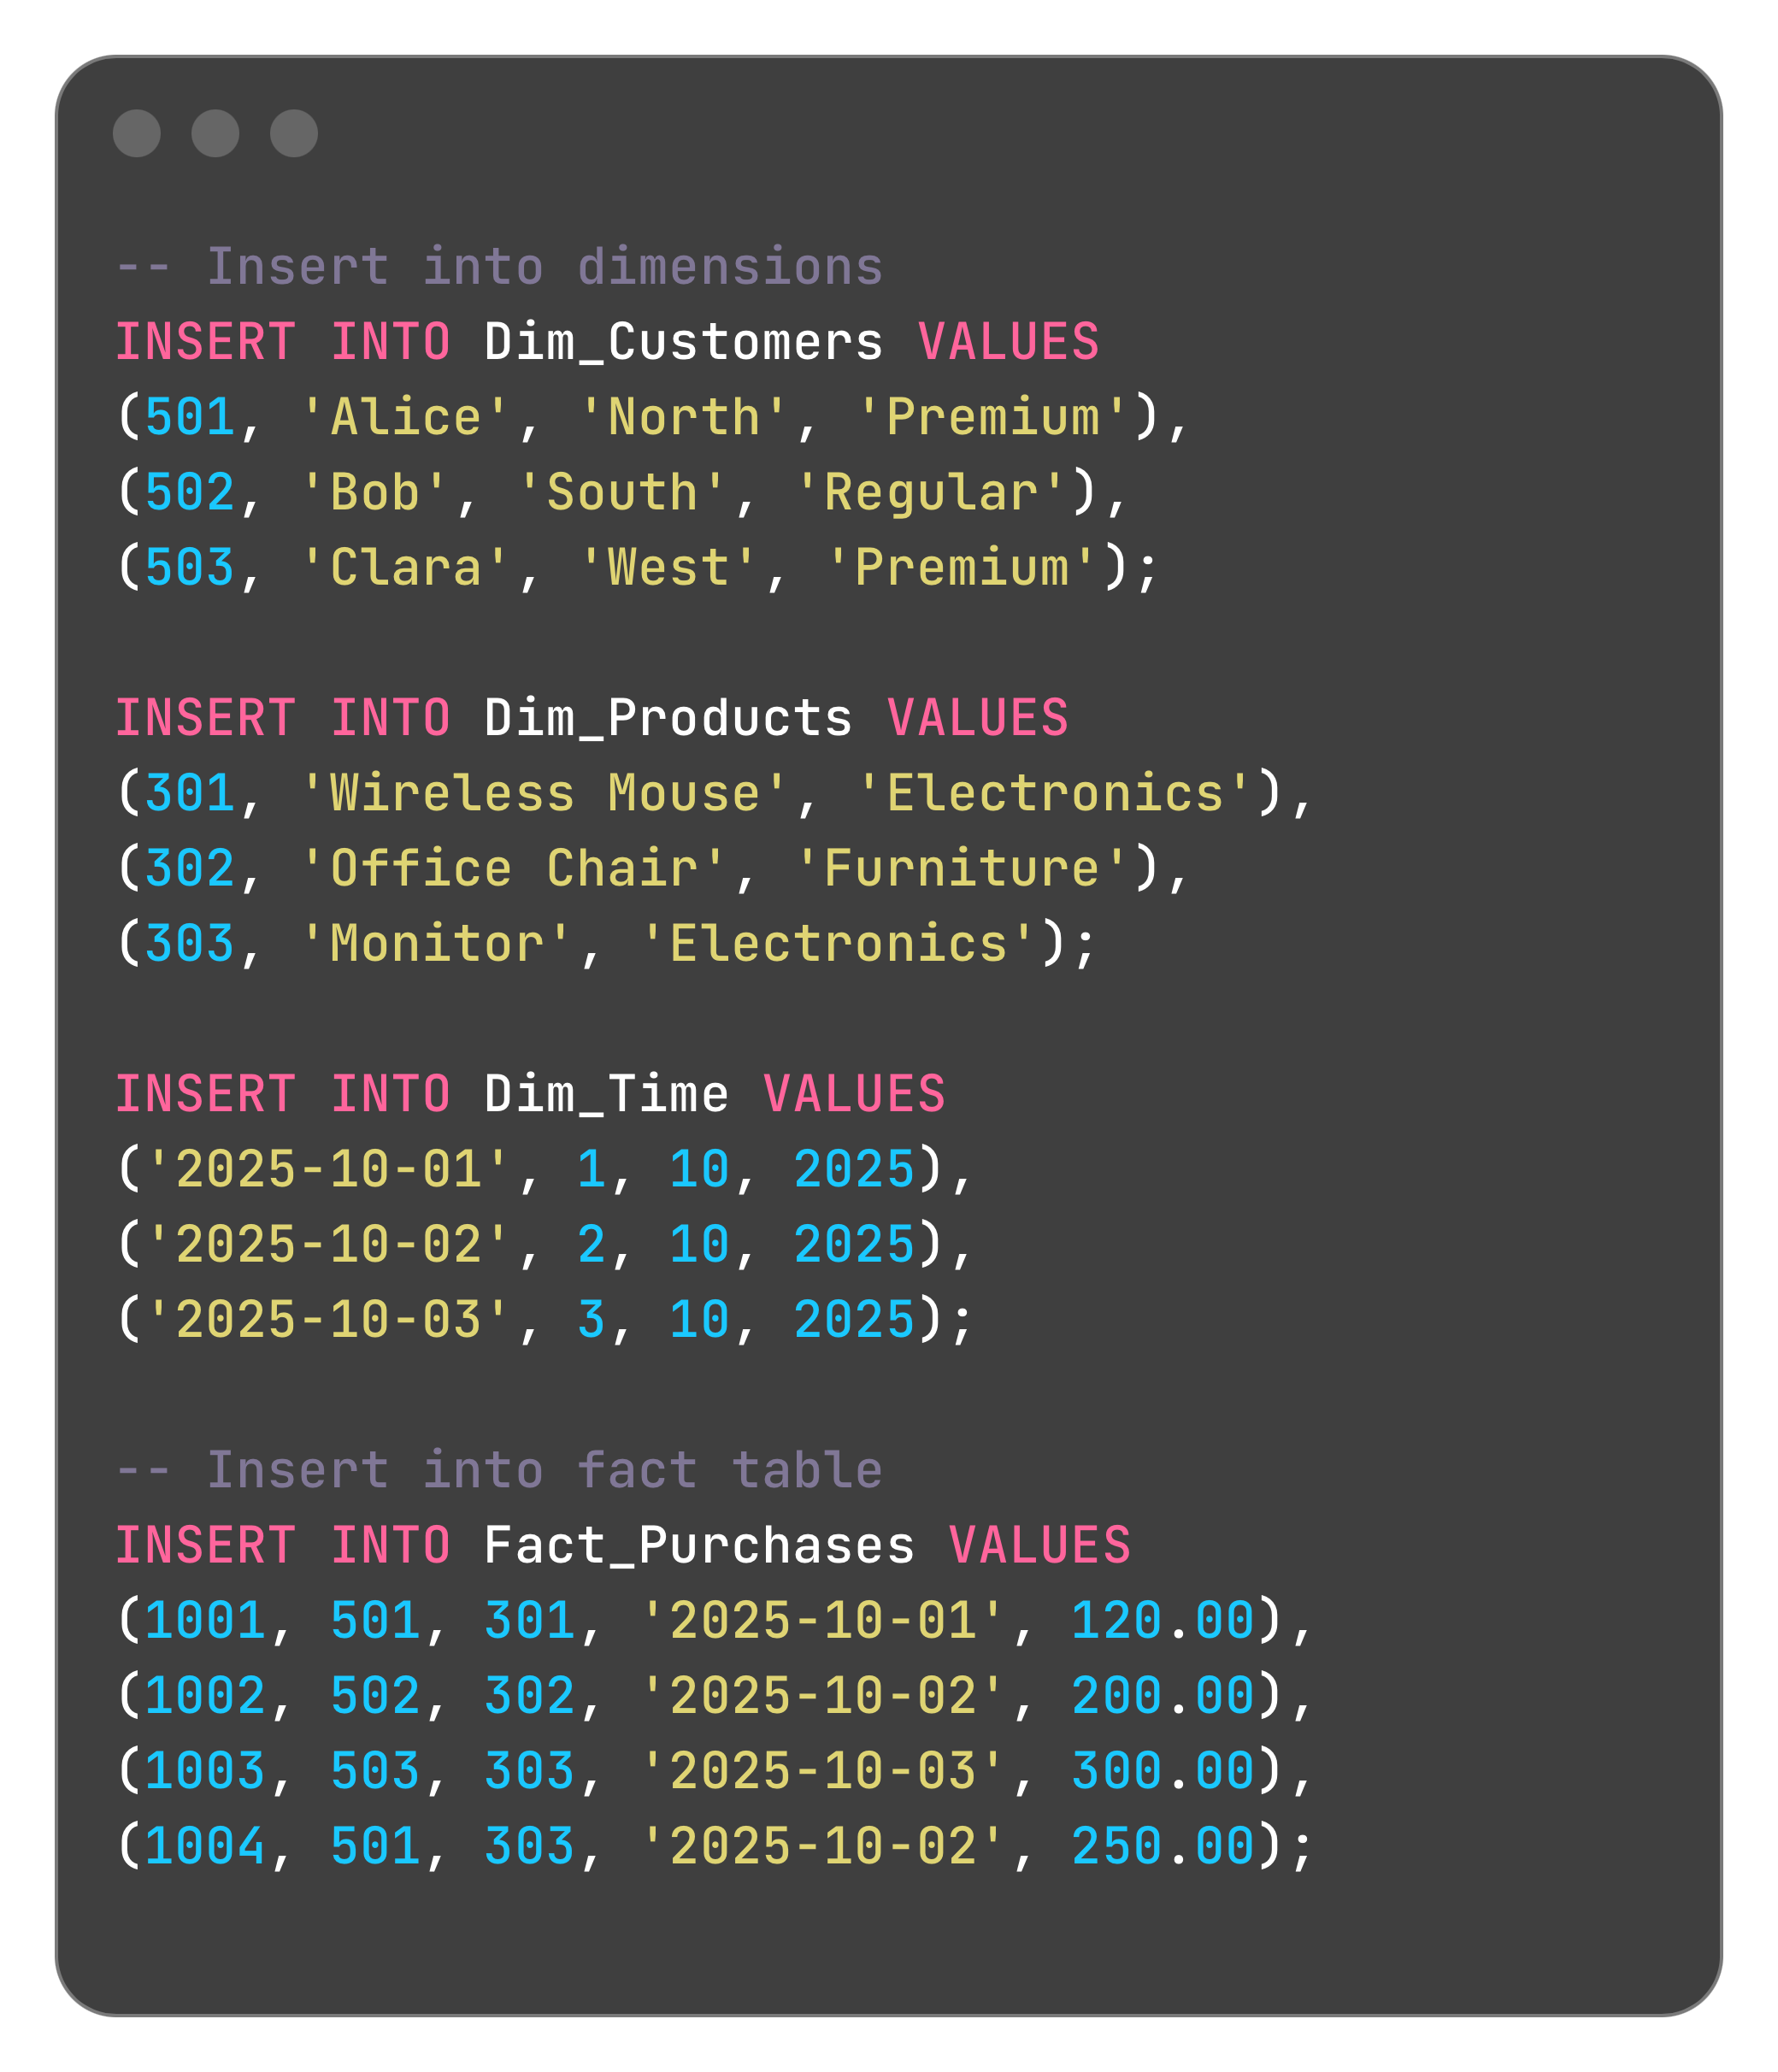
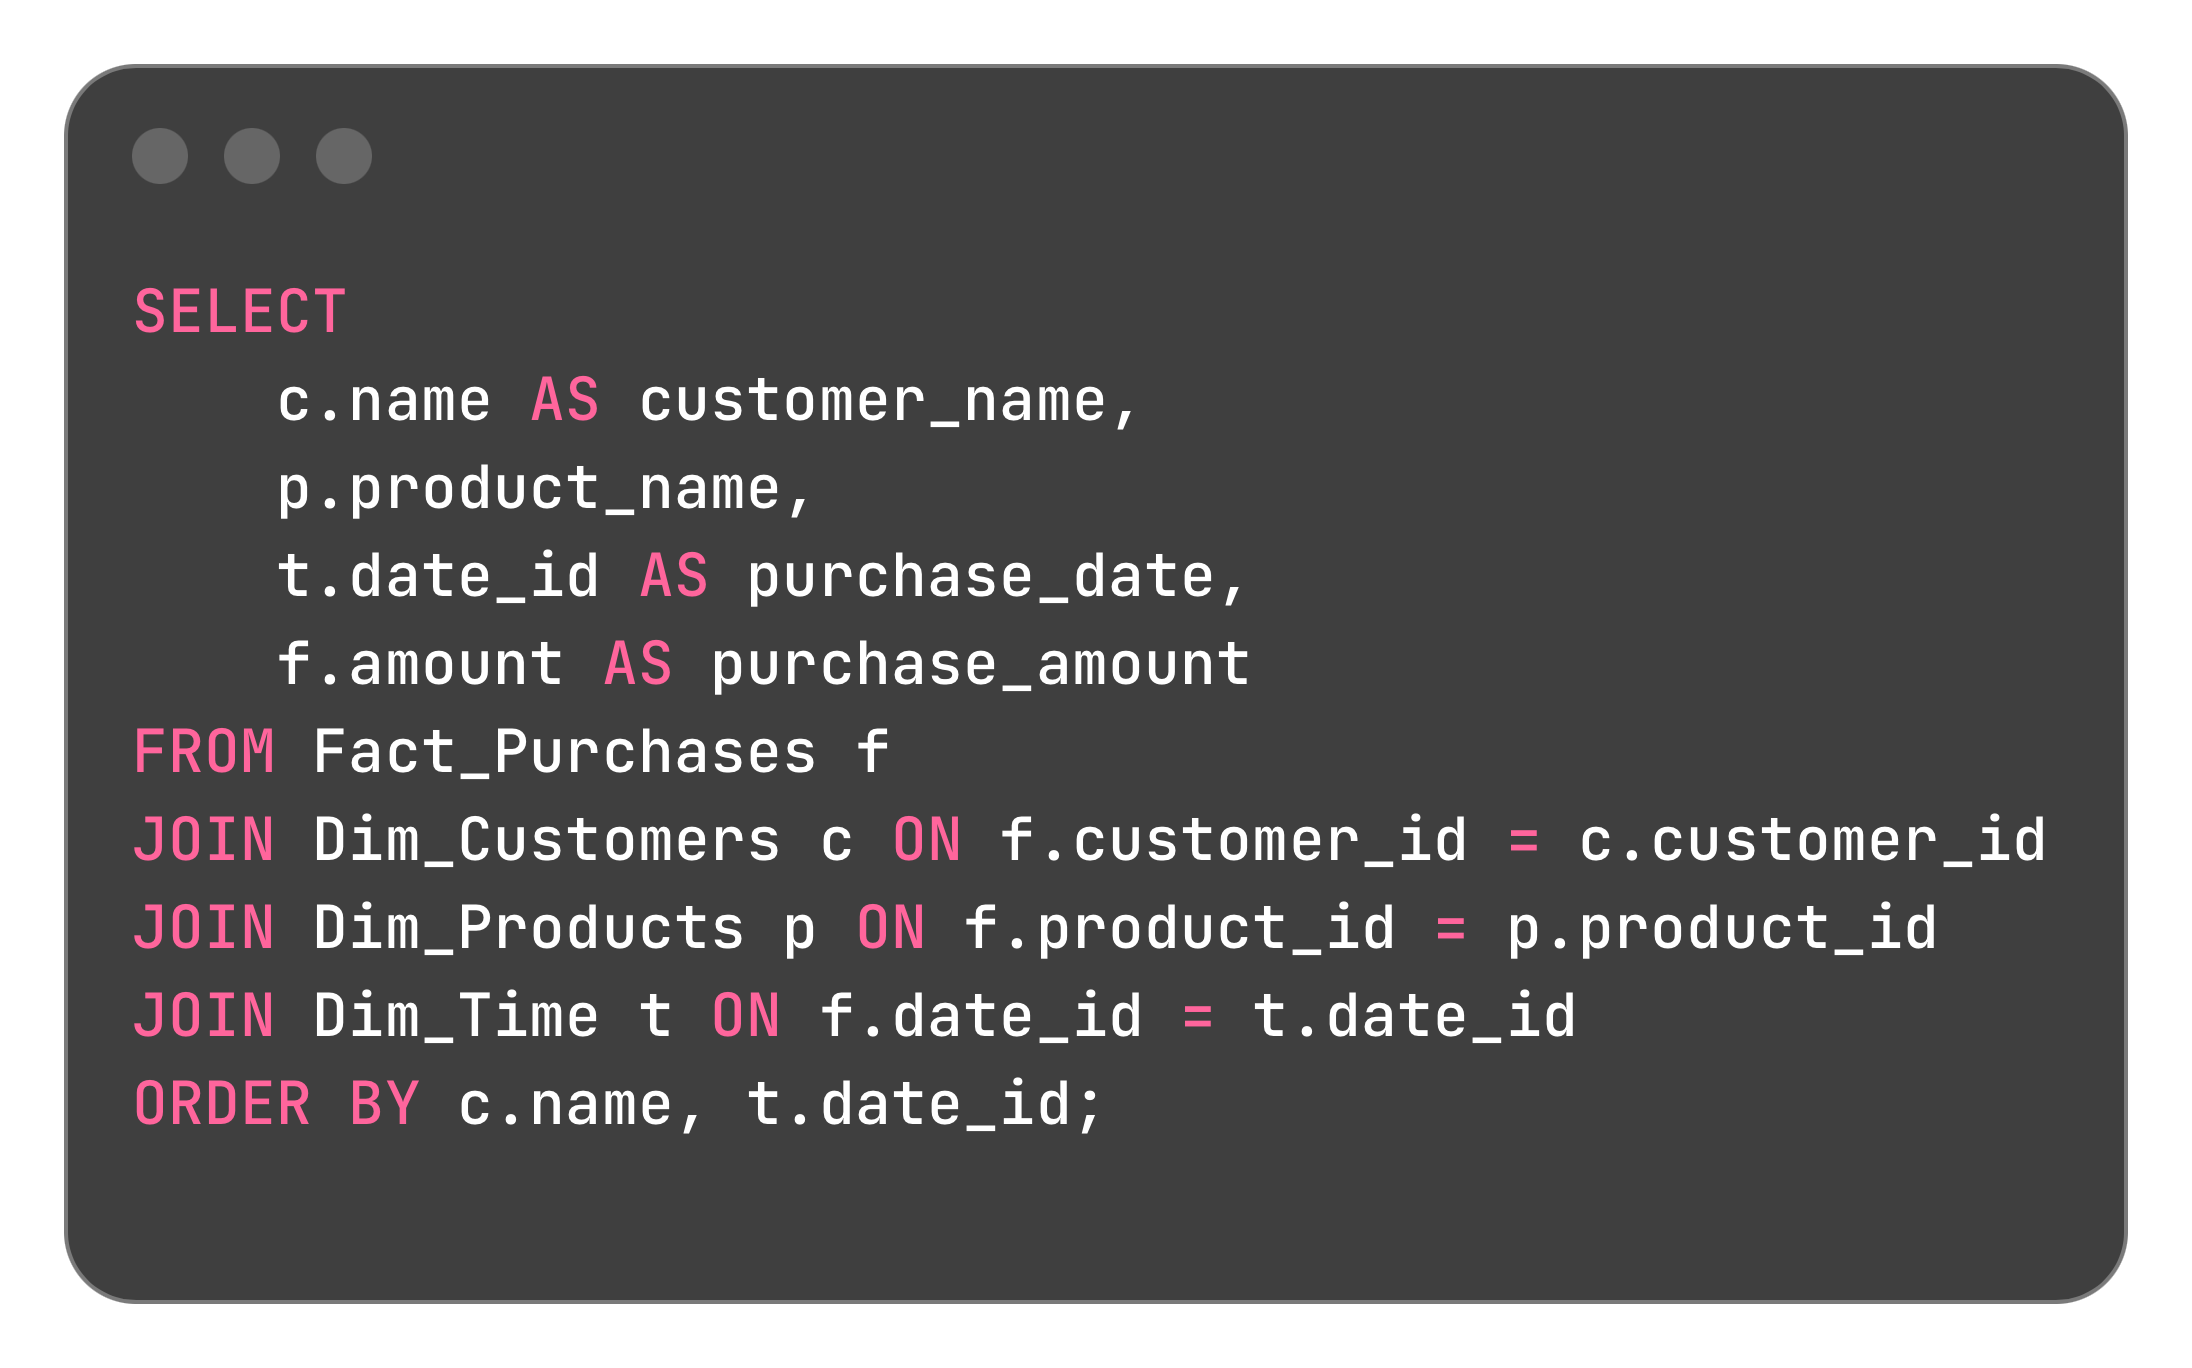
Step 3: Query to Generate Result
Then output:
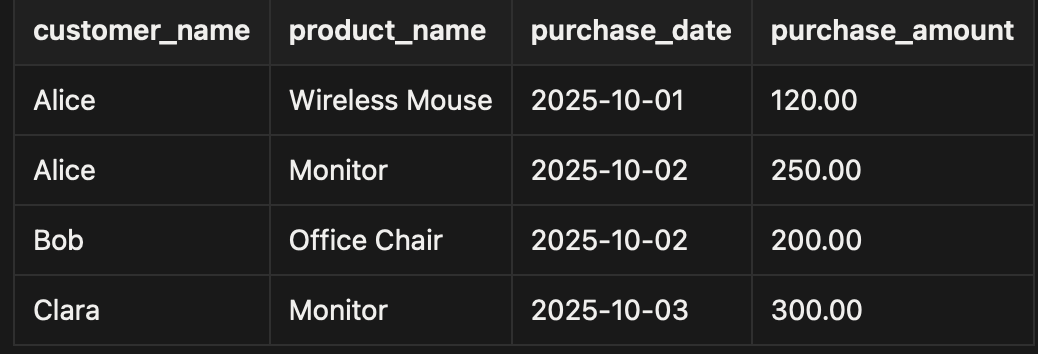
This complete query sequence, from start to end models customer purchases cleanly, showcasing how the fact table logs each order and the dimension tables describe who, what, and when.
Show how this model powers metrics:
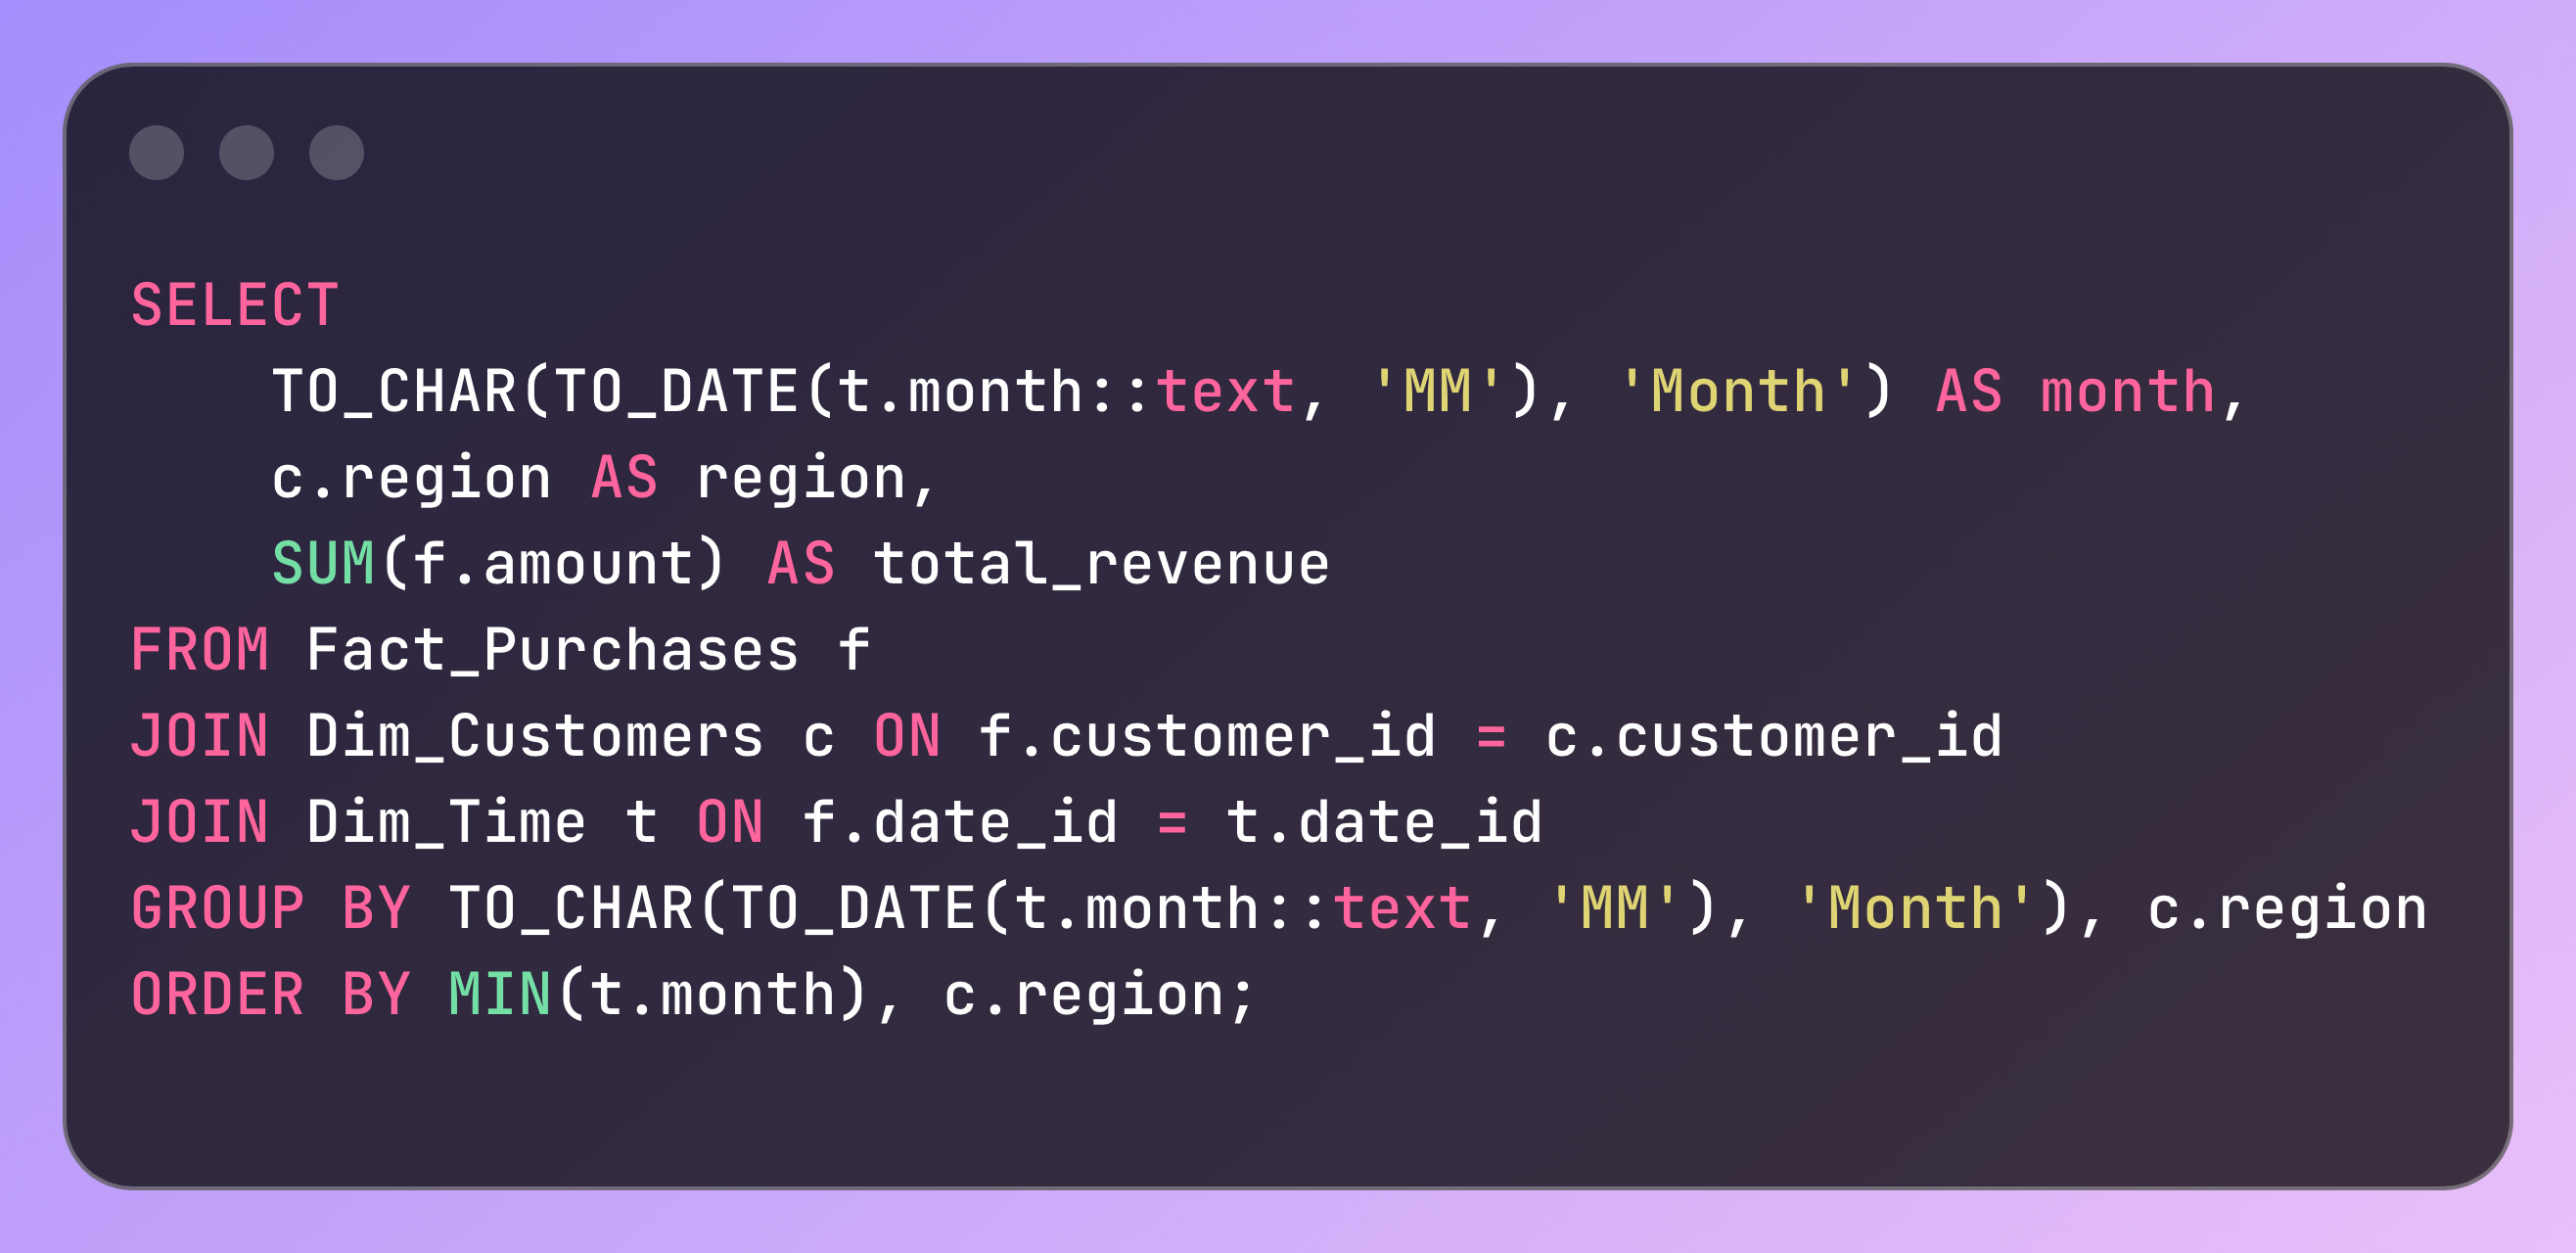
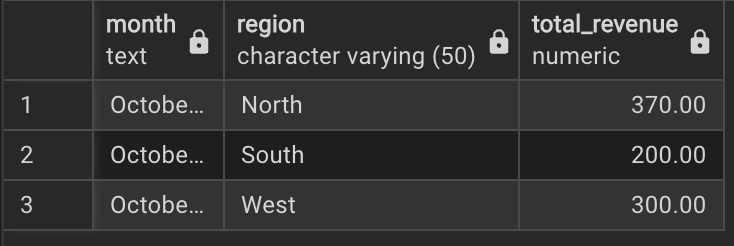
“Want monthly revenue by region? Easy aggregate sales by time and region dimensions.”
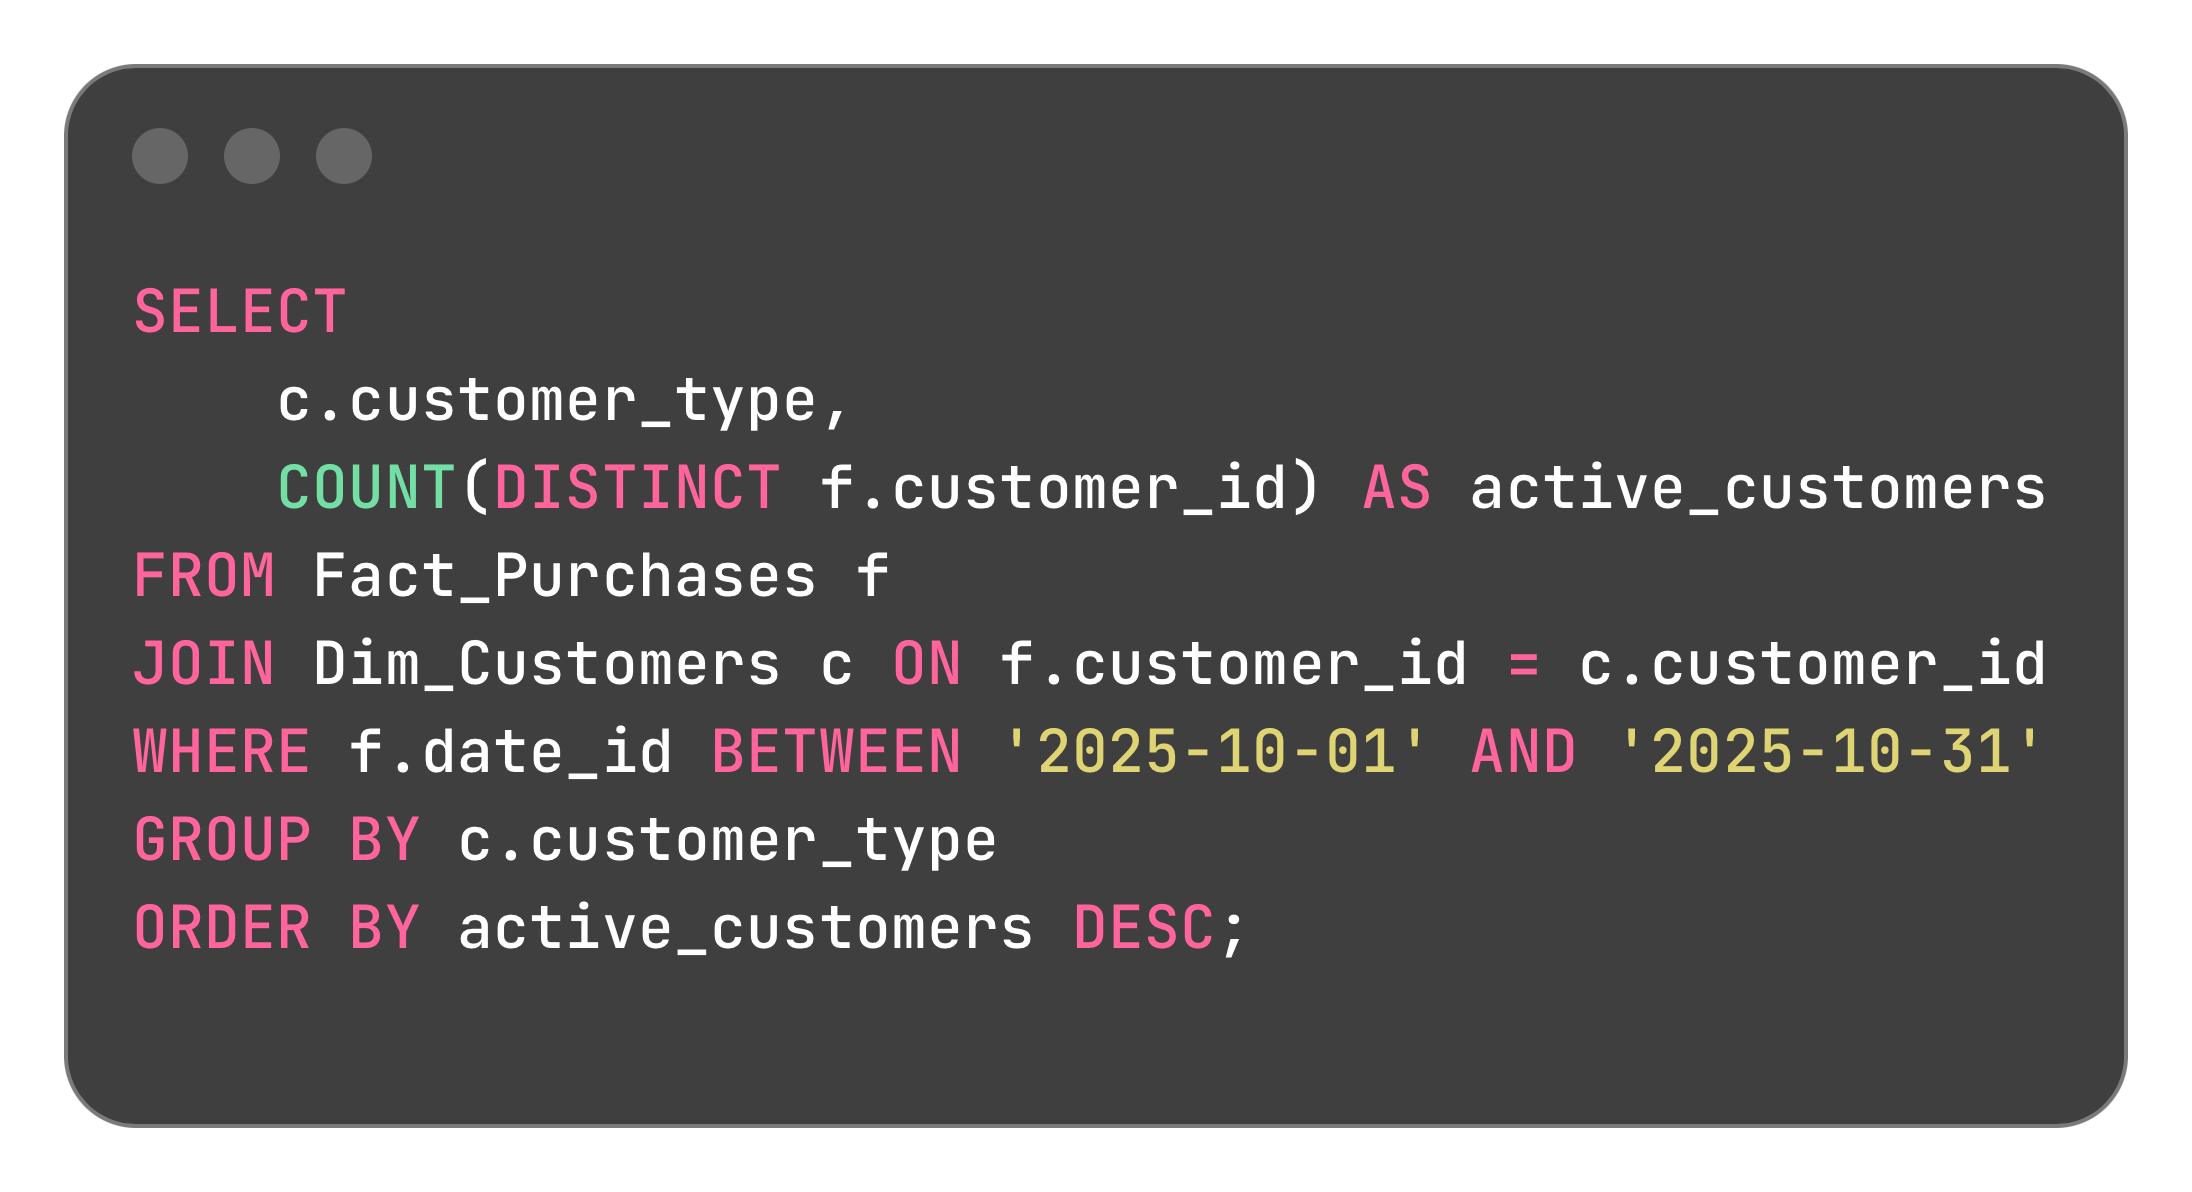
“Want retention by customer type? Join facts to the customer dimension.”
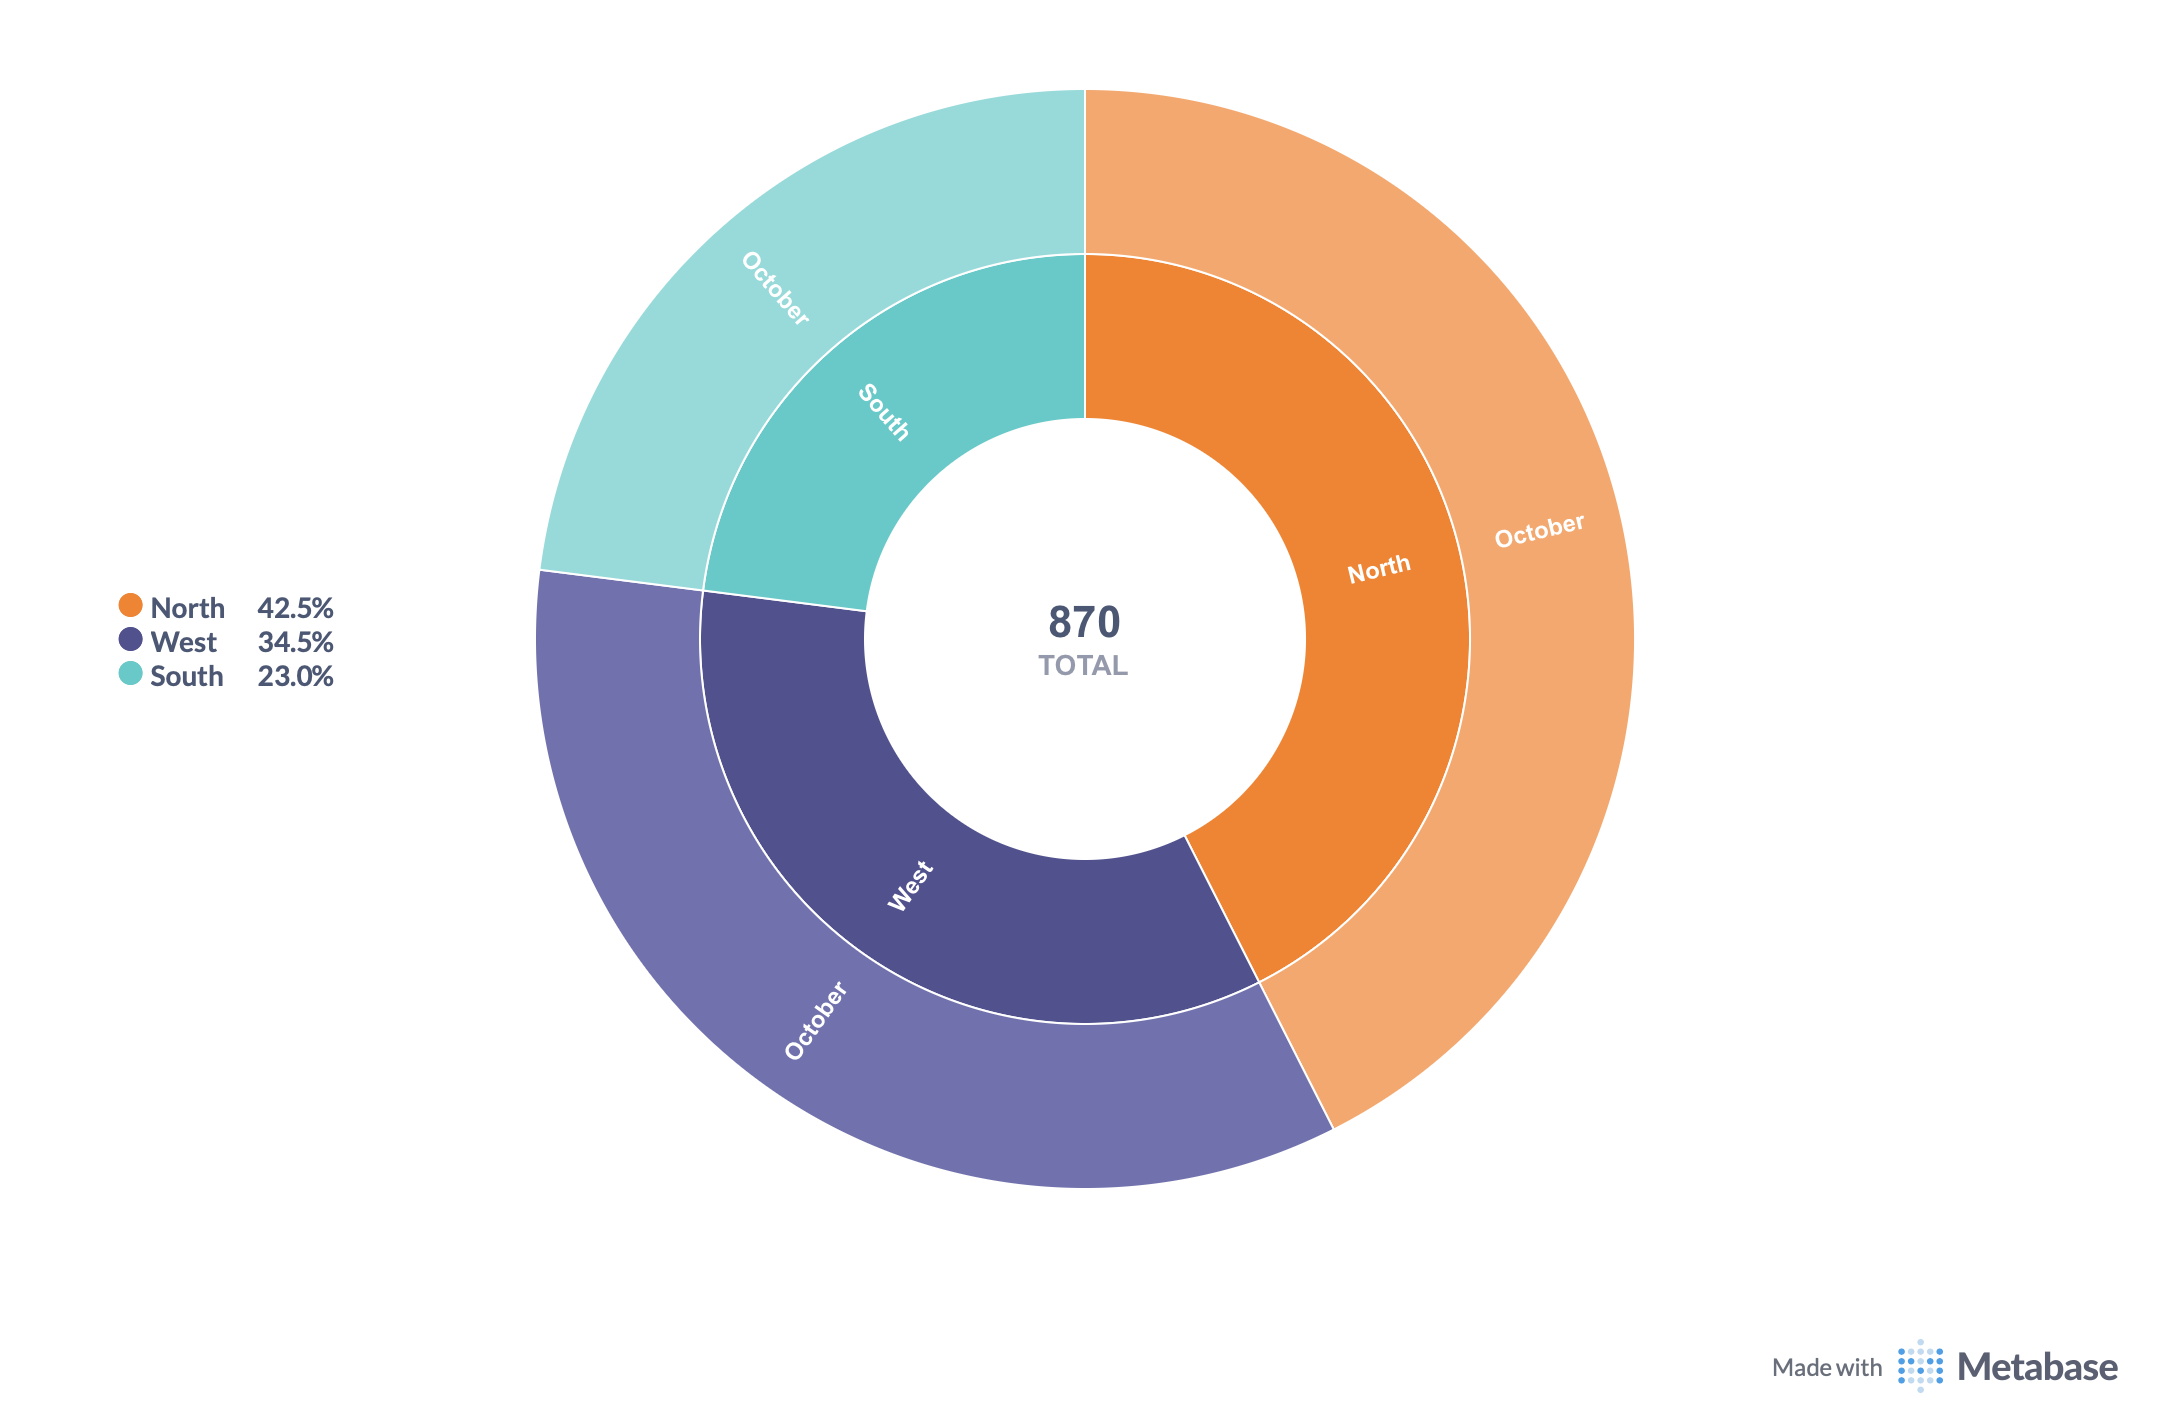
1. Monthly Revenue by Region:
Output:
Graph:
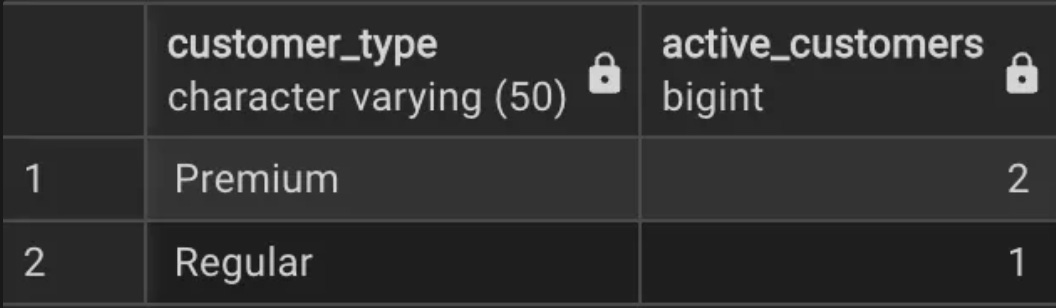
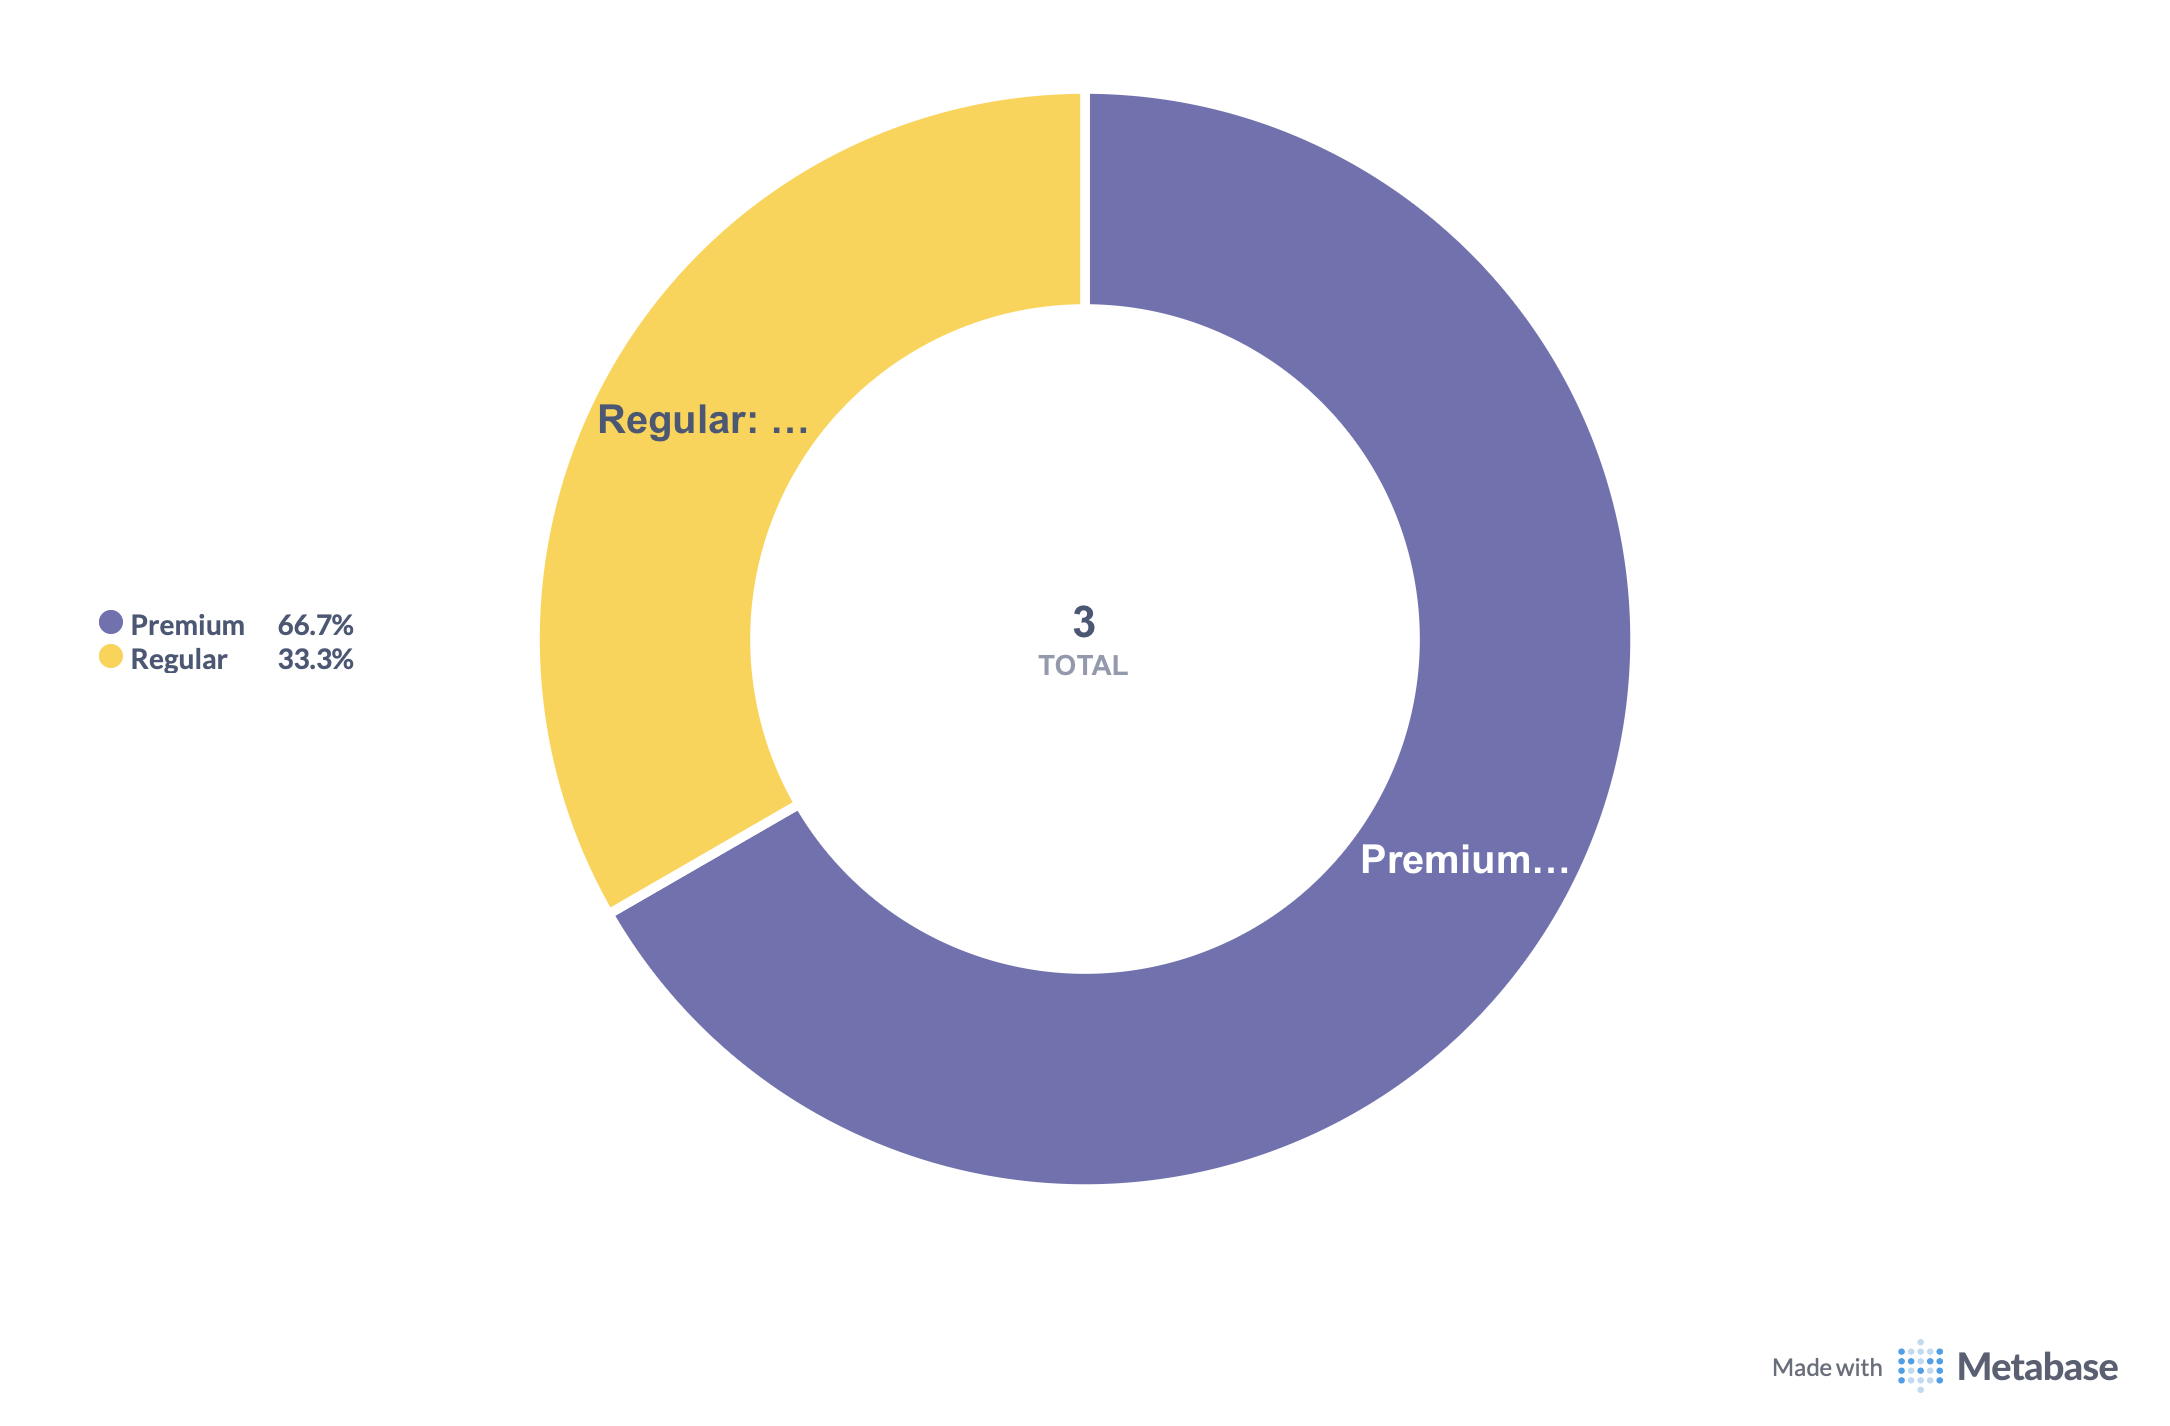
2. Retention by Customer Type:
Output:
Graph:
“Add a key takeaway”:
“Good modeling turns technical structure into business clarity; everyone speaks the same data language.”
7.“Final reflection: What’s Next”
Key Takeaways:
Dimensional modeling is all about clarity.
It streamlines SQL, strengthens metric accuracy, and turns dashboards into tools you’re actually proud to share.
Structured data models do more than organize information they build trust and consistency across every report. Facts capture what happens; dimensions explain why and where it happens. Together, they turn raw data into clear, actionable insight.
Up Next:
In our next blog, we’ll meet the true stars of the analytics world facts and dimensions tables and learn how to tell them apart.