
Advanced SQL Techniques: Grouping Sets, Rollups, and Self Joins”(Deep dive)
Write cleaner, smarter SQL with Grouping Sets, Rollups, and Self Joins.

1. Introduction:
SQL: not just SELECT, meet the power tools you forgot existed
SQL isn’t just about pulling rows with a simple SELECT *. It’s a language packed with hidden features that can make your queries sharper, faster, and far more expressive. Beyond the basics, SQL offers advanced capabilities like Grouping Sets, Rollups, and Self Joins , tools that many developers overlook, but which can completely change how you approach reporting and analysis. Once you know how to use them, you’ll find yourself solving problems more effectively and writing queries that do far more with less code.

2. Foundations: why not just GROUP BY?
Before we get into the advanced stuff, let’s take a quick refresher. GROUP BY is where most SQL users start when they need summaries.It collapses rows, applies aggregates, and gets you answers fast, totals by region, averages by customer, counts by category.
The problem
GROUP BYanswers one question at a time.
if you need totals by region, by product, and the overall total, you end up writing (and maintaining) three queries, or gluing them with UNION ALL.
That’s where Grouping Sets, Rollups, and Self Joins come in. They’re designed to move you past single-level aggregations, so you can capture multiple perspectives, richer breakdowns, and even relational insights, all without writing query after query.
3. Grouping sets: multiple summaries in one query
Grouping Sets are like having multiple GROUP BY clauses rolled into a single query. Instead of writing and unioning separate aggregations, you tell SQL exactly which “buckets” you care about, and it returns them all at once.
Example: one query instead of three
Say you want sales totals:
By country
By product
Overall total
With plain GROUP BY, you’d have to write three separate queries and glue them with UNION ALL:
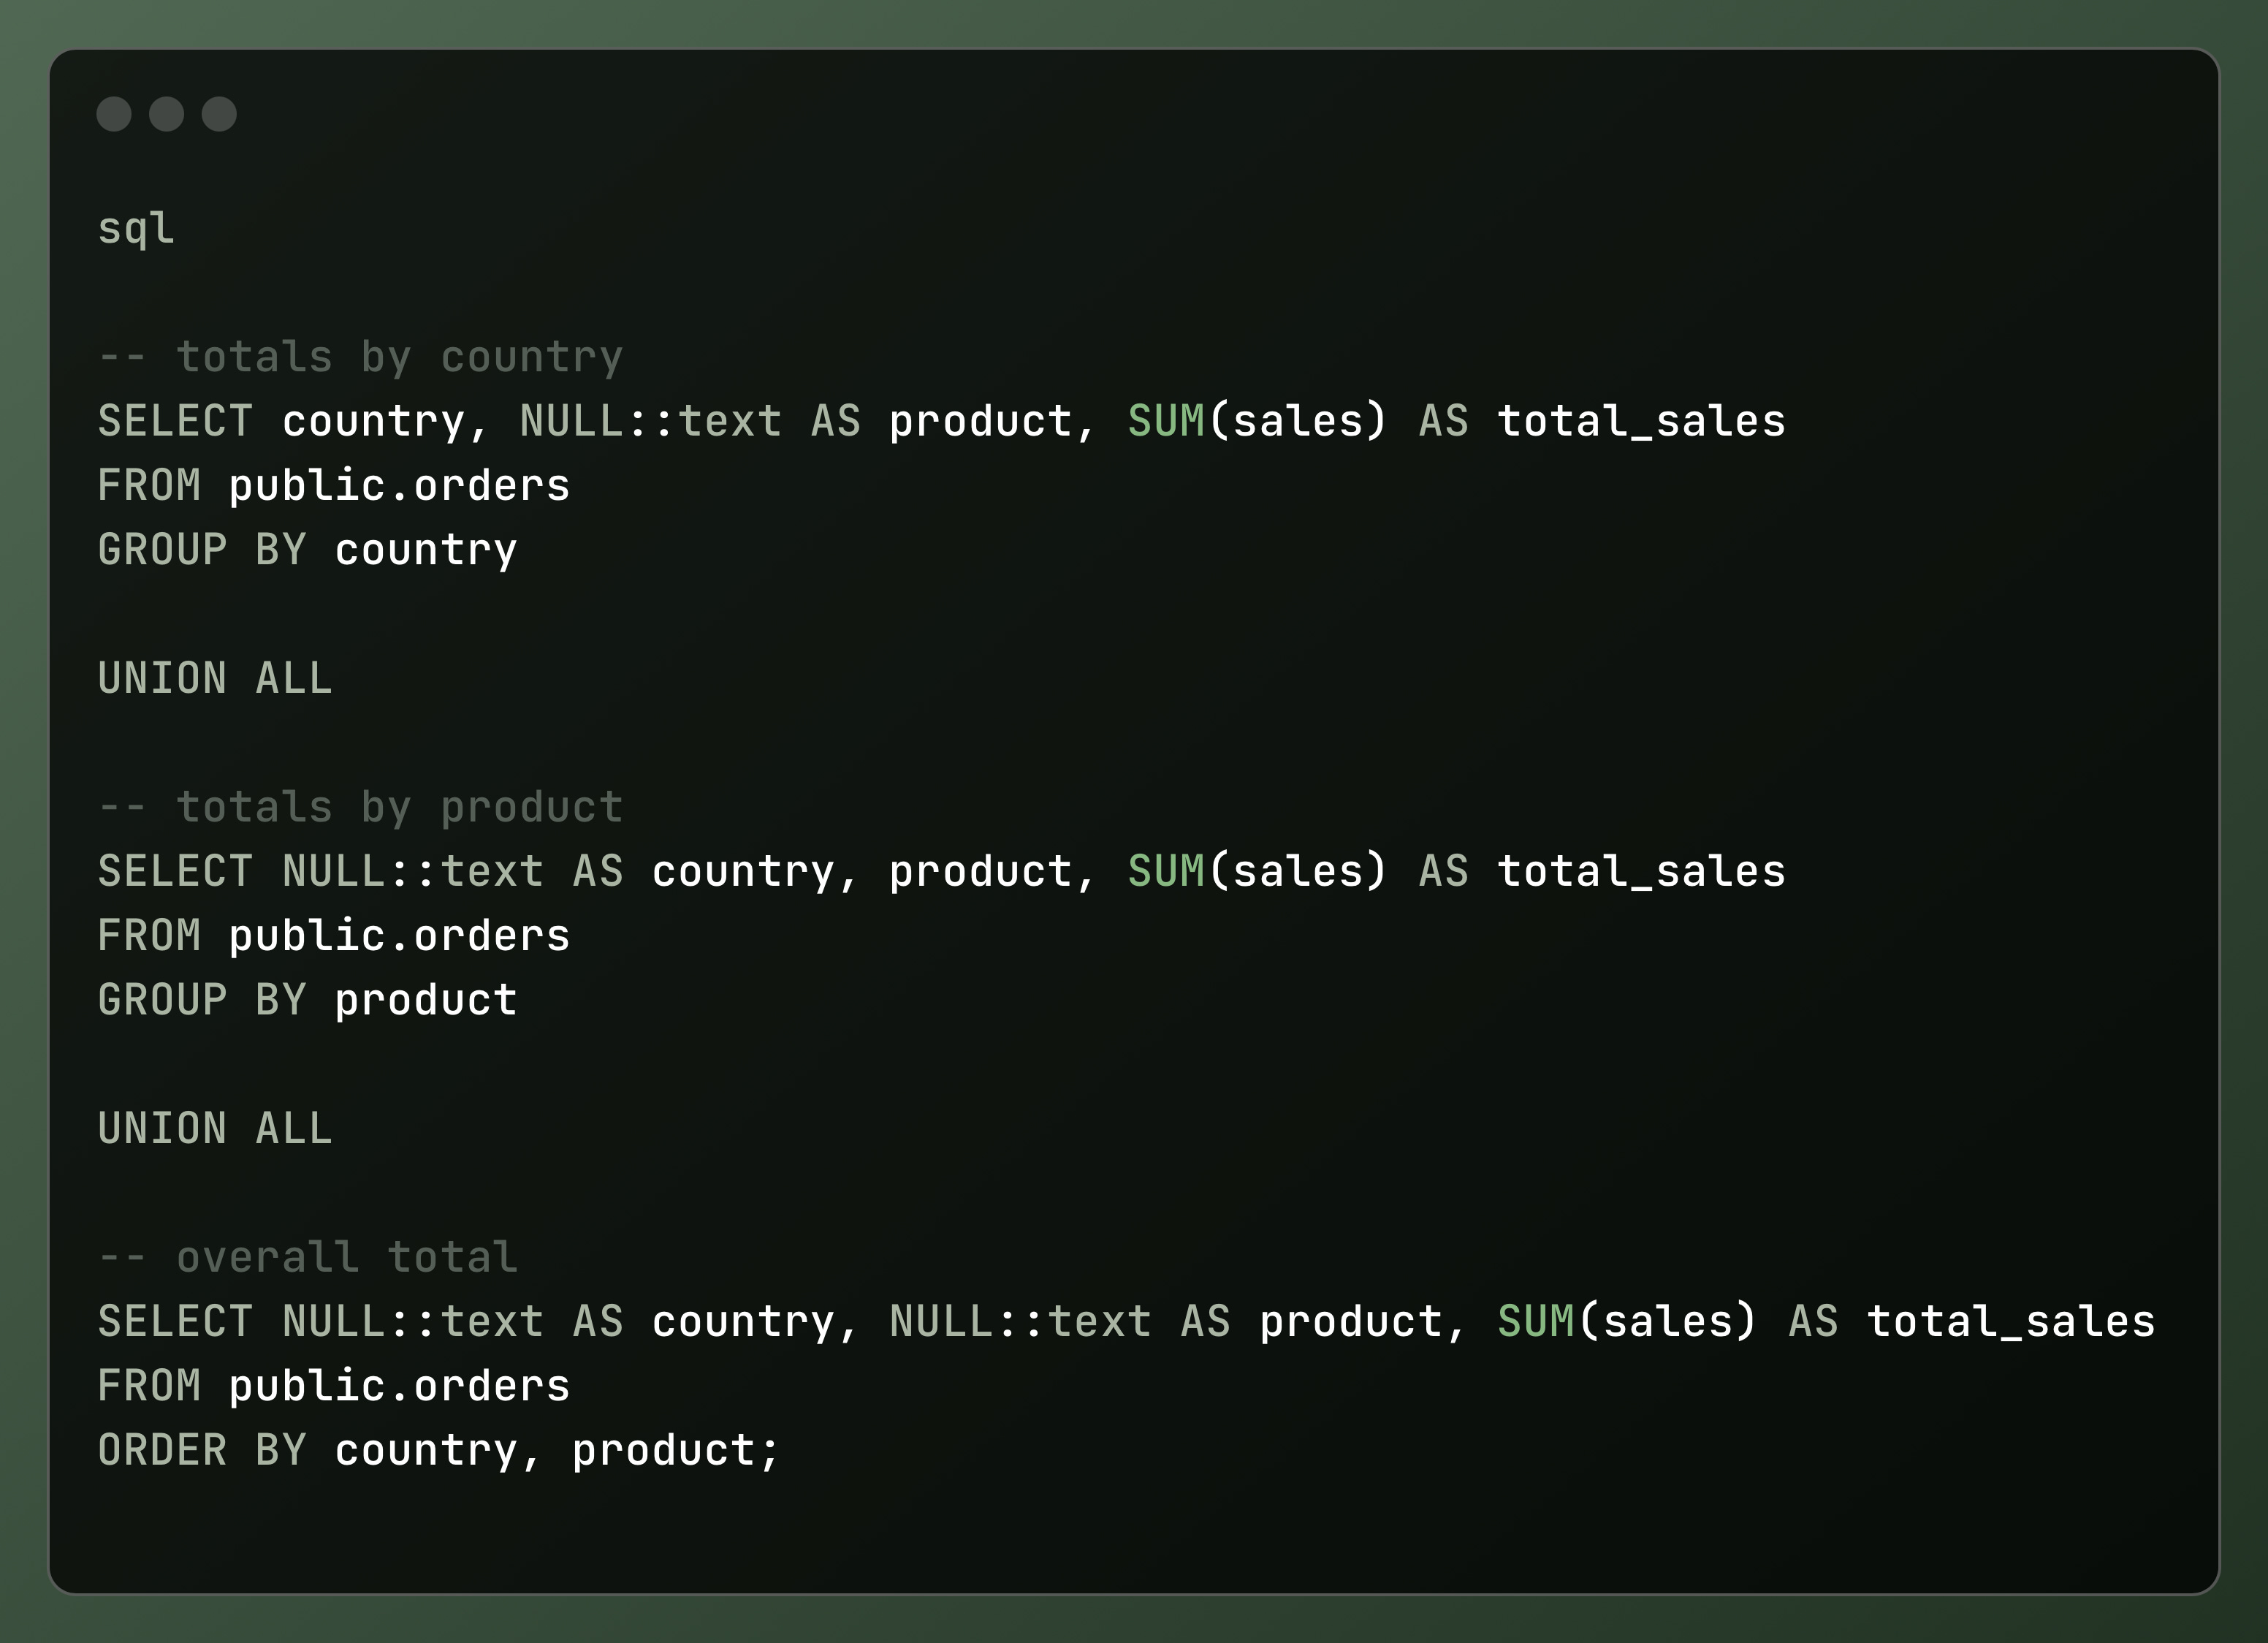
With Grouping Sets, it’s one clean query:
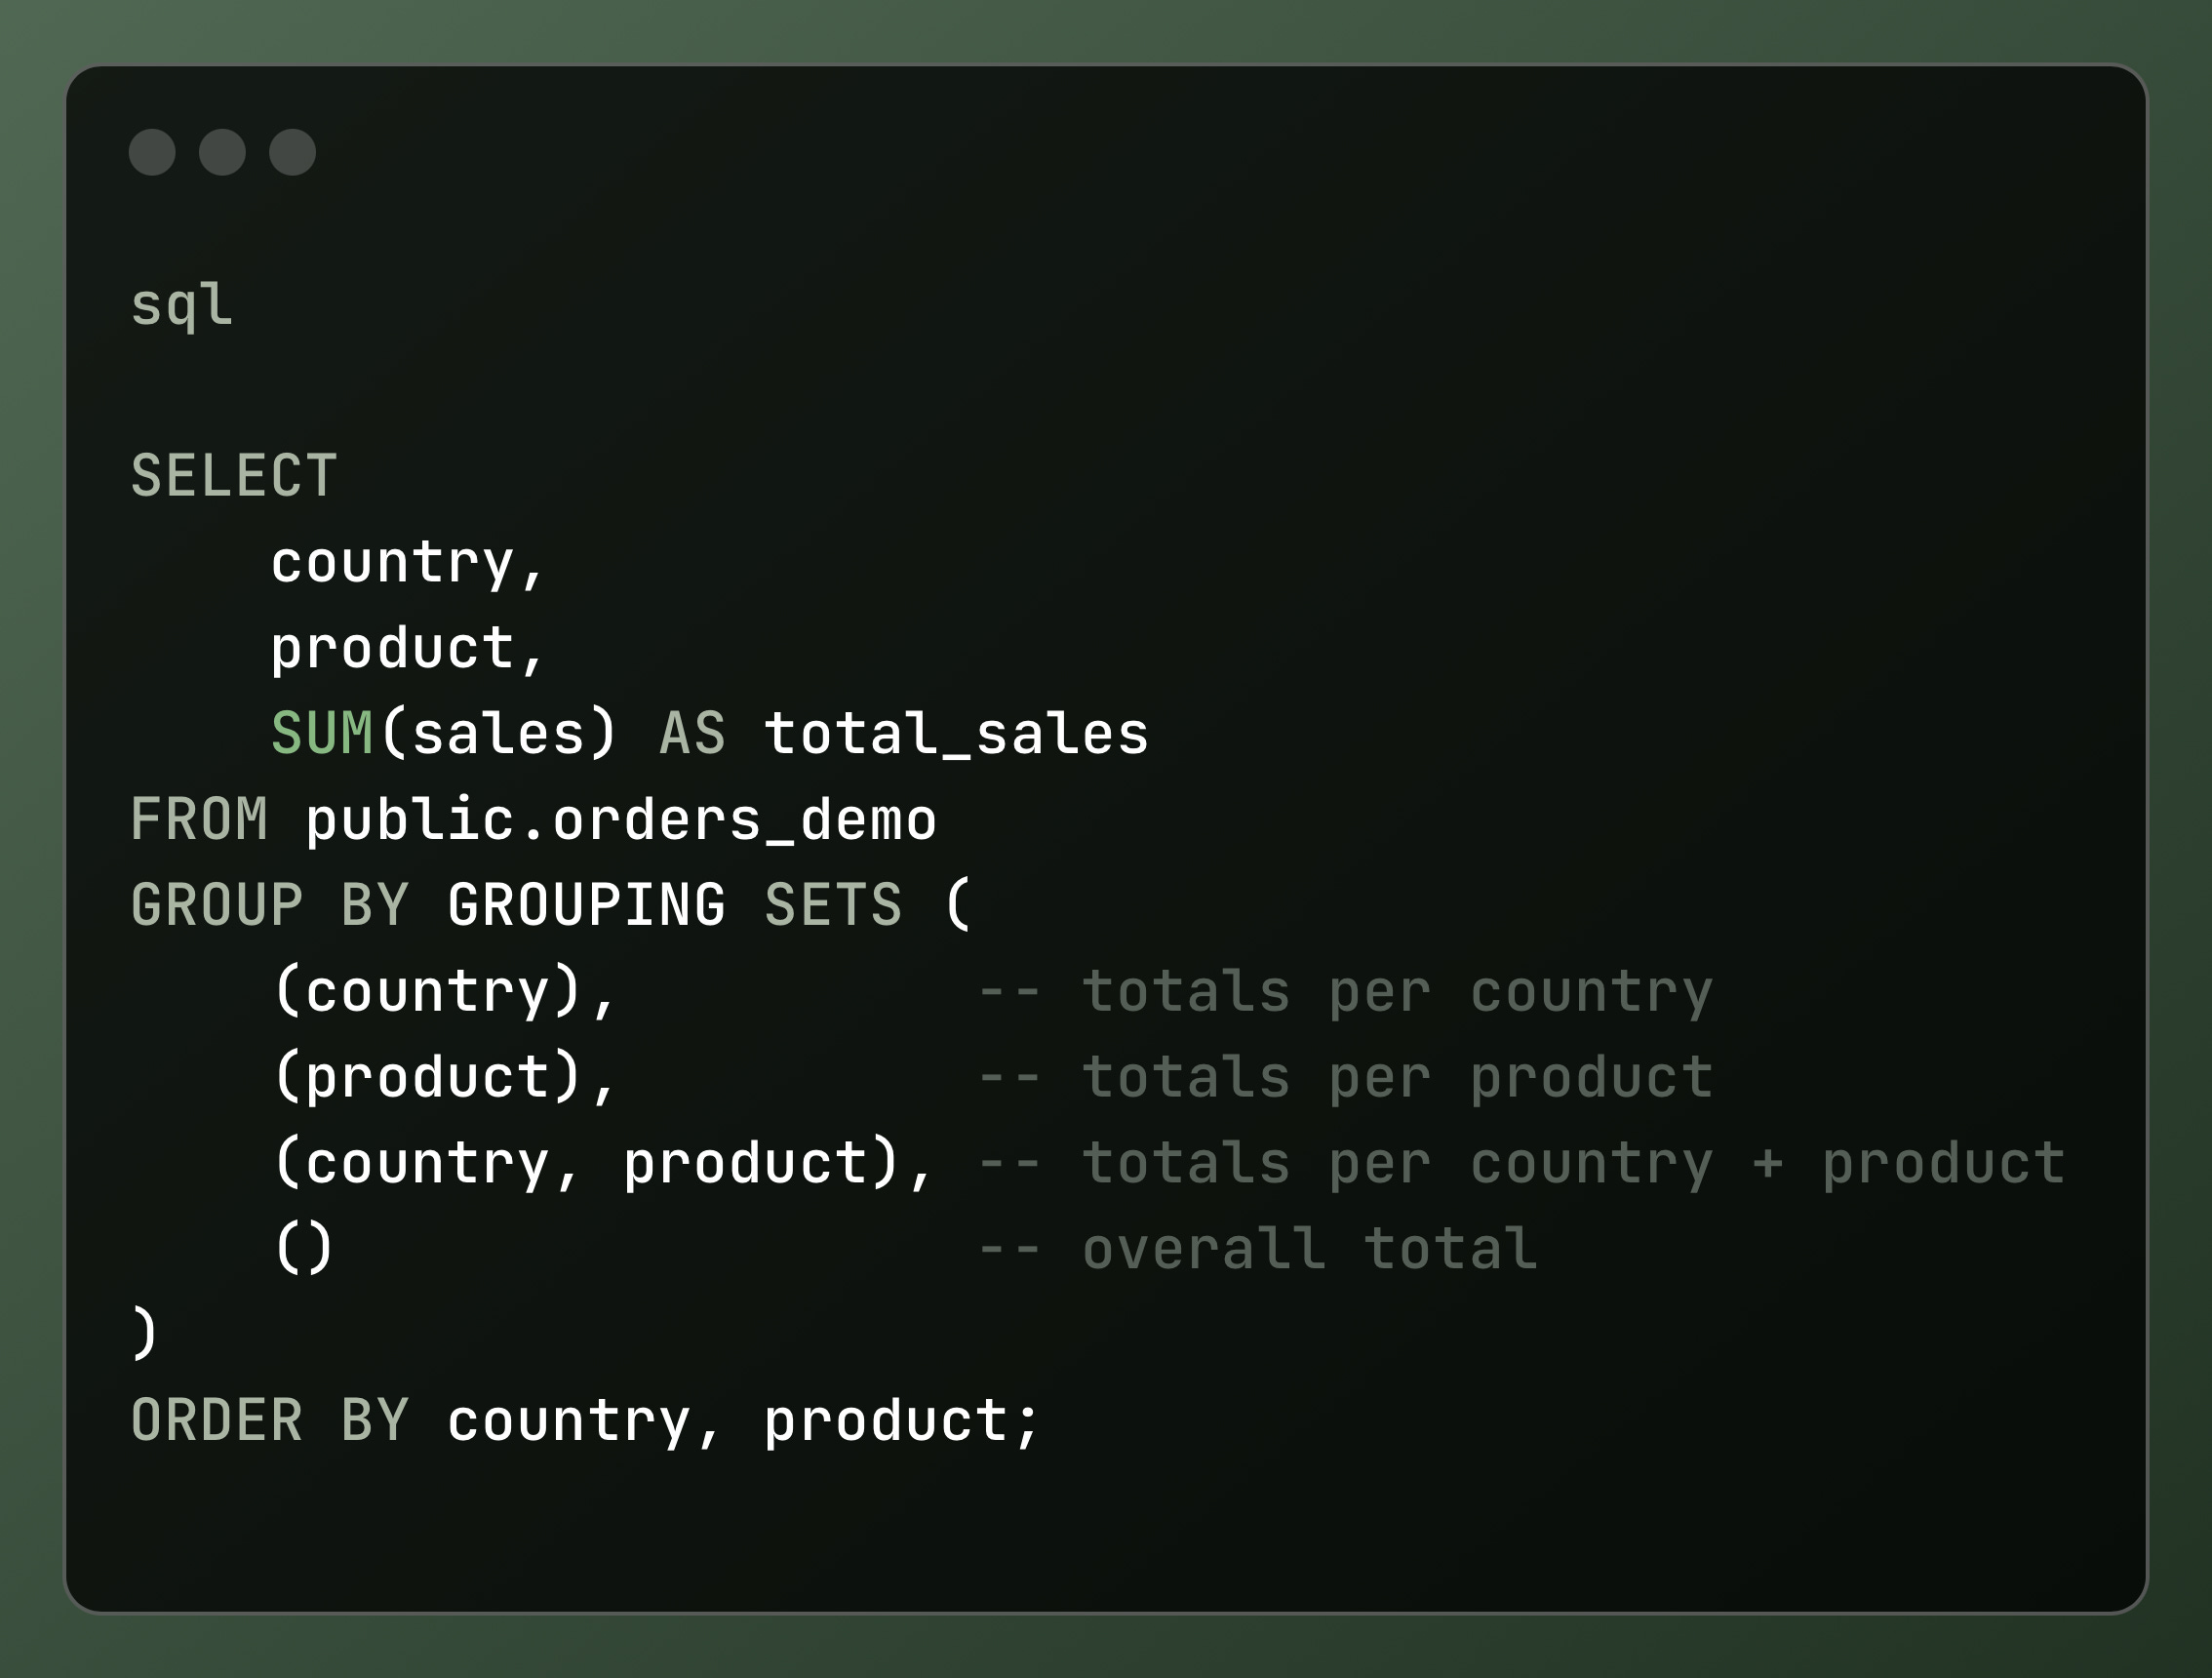
output:
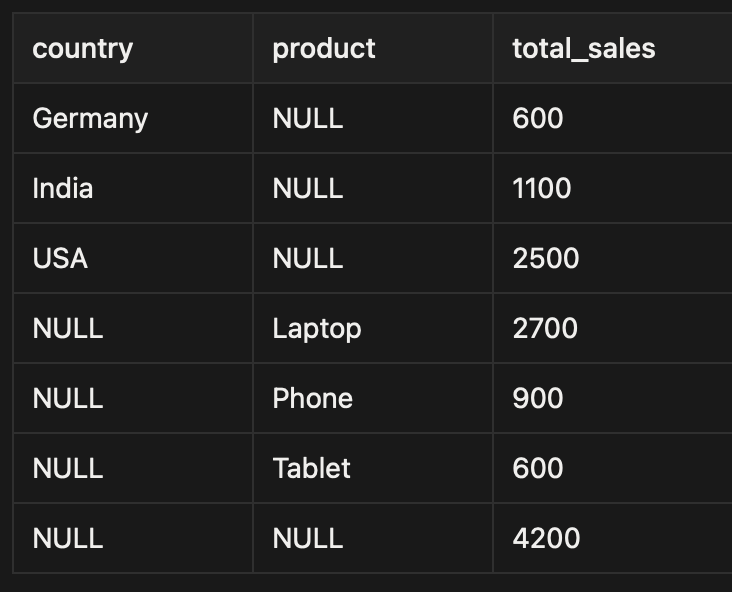
✅ Result: You get all three aggregations in a single result set, no unions, no duplicate queries.
When to use grouping sets:
Dashboards → where you want country-level, product-level, and global KPIs all pulled at once.
Reports → monthly or quarterly summaries that combine different aggregation levels side by side.
Multi-level summaries → subtotals, grand totals, and detailed breakdowns generated in one pass.
In short:
Anytime you find yourself writing the same SUM or COUNT three different ways, Grouping Sets can probably collapse it into a single, elegant query.
4. Rollups
What Are rollups?
A Rollup is a GROUP BY shortcut that creates progressive subtotals along a hierarchy. You give SQL an ordered list of columns, and it automatically returns results at every level, from the most detailed grouping down to the grand total.
Example: website traffic by date
Suppose you’re analyzing website visits and want to see:
Visits by year and month
Visits by year
The overall total
You can do this with a single query using ROLLUP:
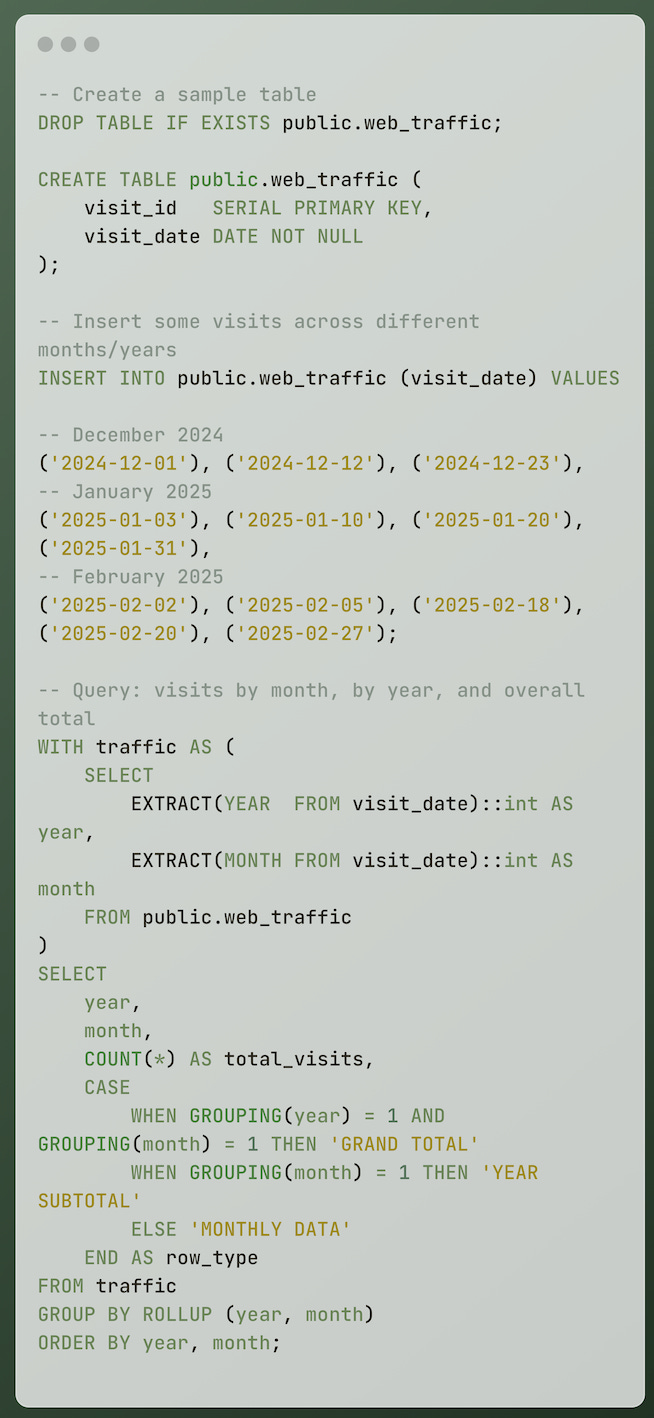
output:
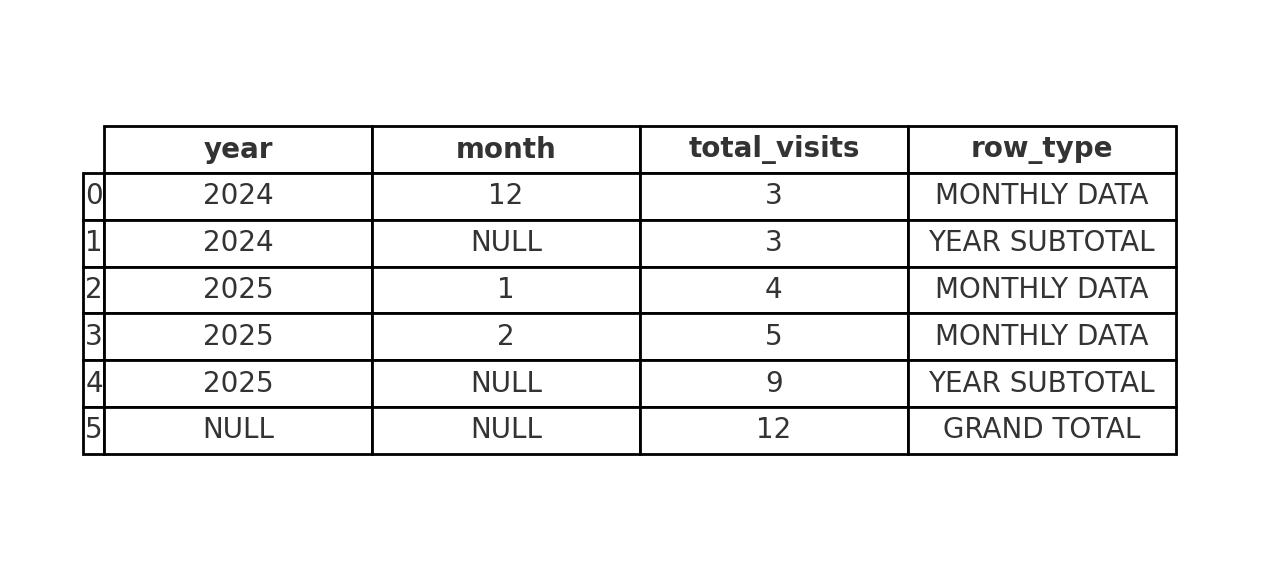
👉 So with a single query using ROLLUP, you’ve got:
year → Year of the visit(s).
month → Month of the visit(s).
total_visits → How many visits happened in that year/month.
row_type → Label telling you whether the row is monthly detail, a yearly subtotal, or the overall grand total.
How rollups compare to grouping sets:
Both Grouping Sets and Rollups let you collapse multiple aggregations into one query, the difference is in control vs convenience.
Grouping Sets → You spell out each grouping you want. Perfect when you need a custom mix (e.g. totals by country, by product, but not both together).
Rollups → You hand SQL a hierarchy, and it builds every subtotal and the grand
total for you. Less typing, cleaner code, but the shape is fixed.
In short:
Use Grouping Sets when you want custom, non-hierarchical views.
Use Rollups when you want hierarchical roll-ups with minimal effort.
Analogy
“Rollups are like elevator stops: you can get off at the city floor, the state floor, the country floor, or ride all the way up to the grand total.”
It conveys the hierarchical nature (each level builds on the last), but in a way that’s easy to visualize.
5. Self Joins:
A self join is simply joining a table to itself. Instead of pulling data from two different tables, you treat the same table as if it were two, usually by giving each instance an alias.
Real-world examples:
Comparing rows:
In a weather table, join each city’s record to another city’s record on the same date to compare conditions (e.g., New York’s temperature vs. Los Angeles’ temperature on June
Time-series analysis:
In the same weather table, join today’s weather record for a city to yesterday’s record to track day-over-day changes in temperature, rainfall, or humidity.
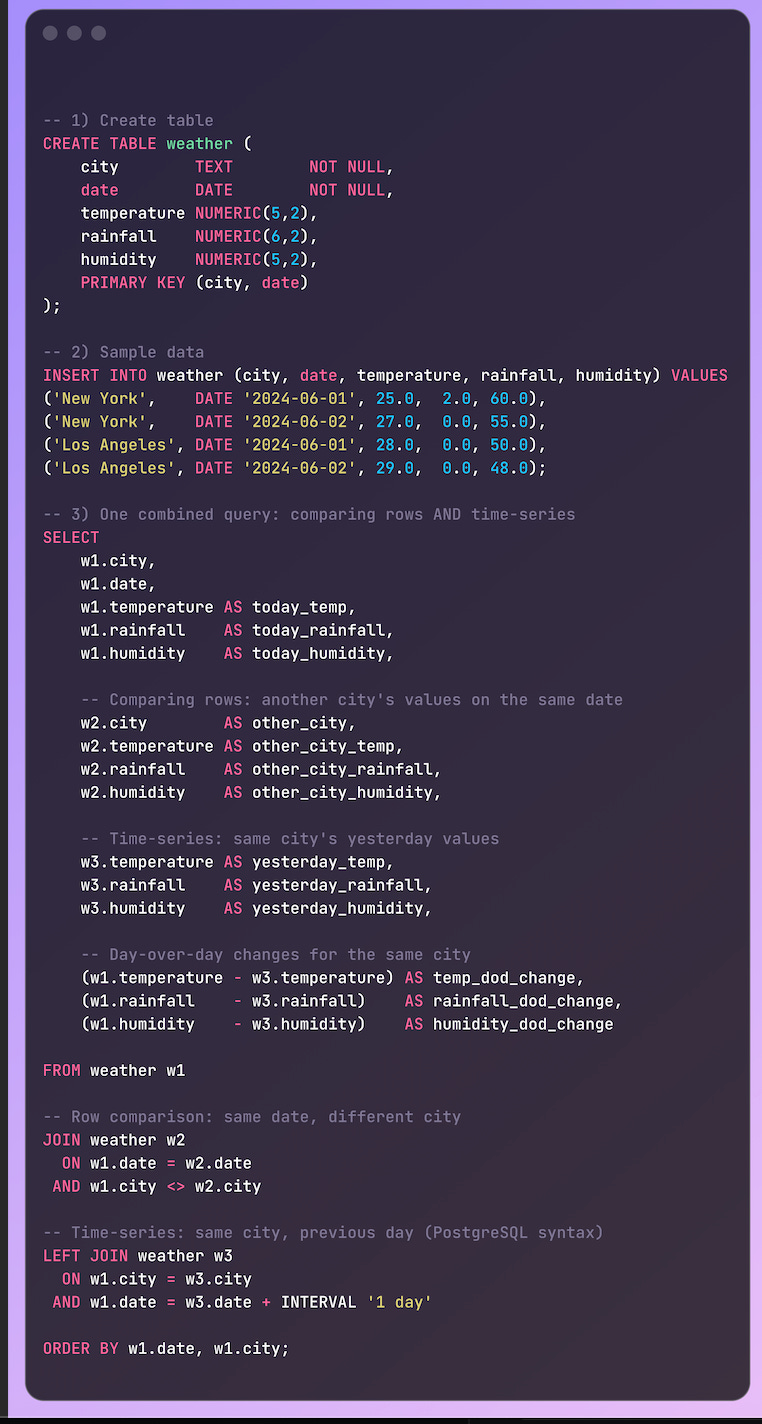
Output:

✅ In one query, you get:
Row comparison → city vs. city, same date.
Time-series → today vs. yesterday, same city.
Changes over time in temperature, rainfall, humidity.
Why self joins matter in analytics:
Comparisons → how one row stacks up against another (city vs. city, product vs. similar product).
Trends → how a row evolves over time (today vs. yesterday’s weather, last month vs. this month’s reading).
Hierarchies → how rows connect in a structure (employee vs. manager, category vs. subcategory).
In analytics, this means you’re not limited to totals and averages. A self join shows patterns, progressions, and relationships, the deeper layer of meaning that makes raw data actionable.
Analogy:
“It’s like comparing today’s selfie to yesterday’s, same subject, new context.”
6. Putting it all together
Scenario: team productivity — dept → manager rollups
Problem:
In most organizations, productivity metrics are stored at the employee level (e.g., hours worked, tasks completed, revenue generated). But business leaders don’t just need to see this information for individuals, they need rollups across the hierarchy:
A manager wants to see how their team performed.
A department head wants to see all their managers’ totals, plus comparisons across them.
The company wants to see aggregated totals across departments.
Goal:
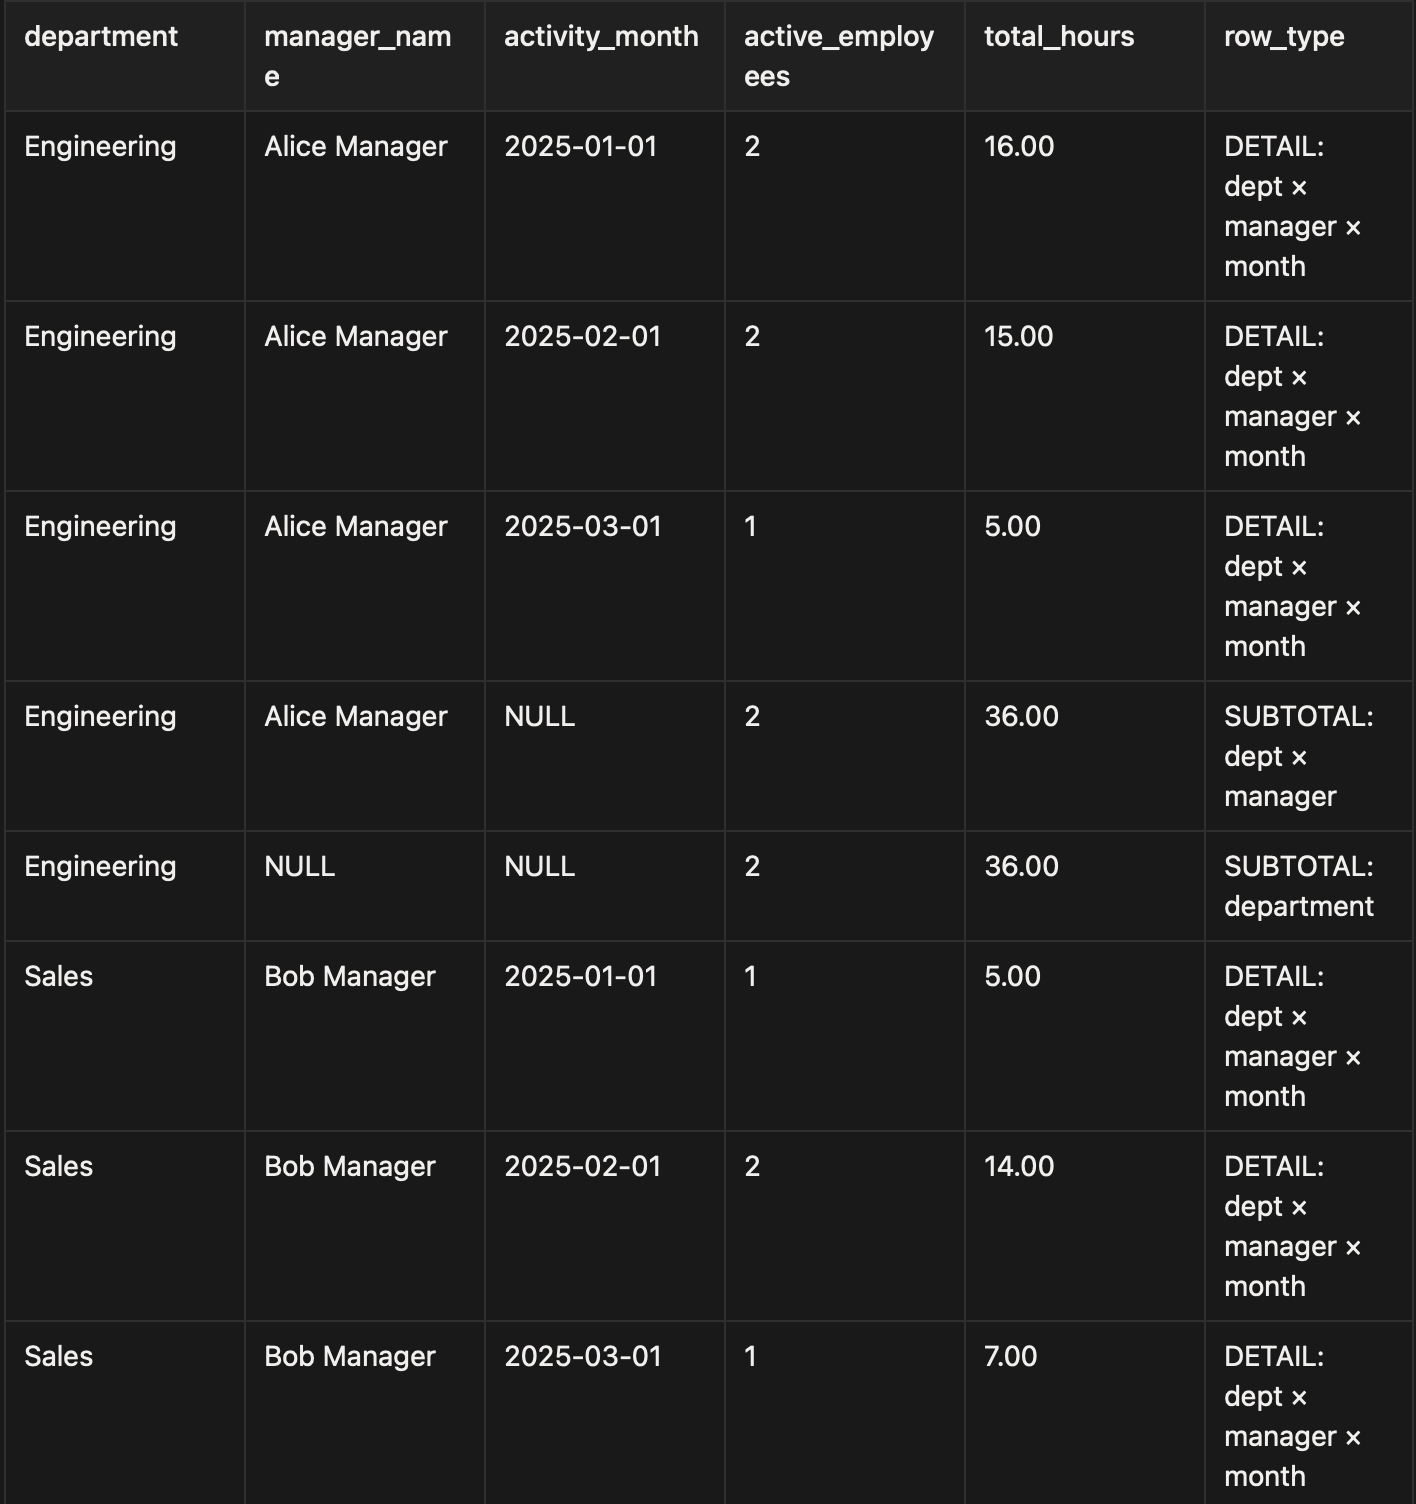
i-level metrics by department × manager × month
Compare employees under each manager (self-join to the manager)
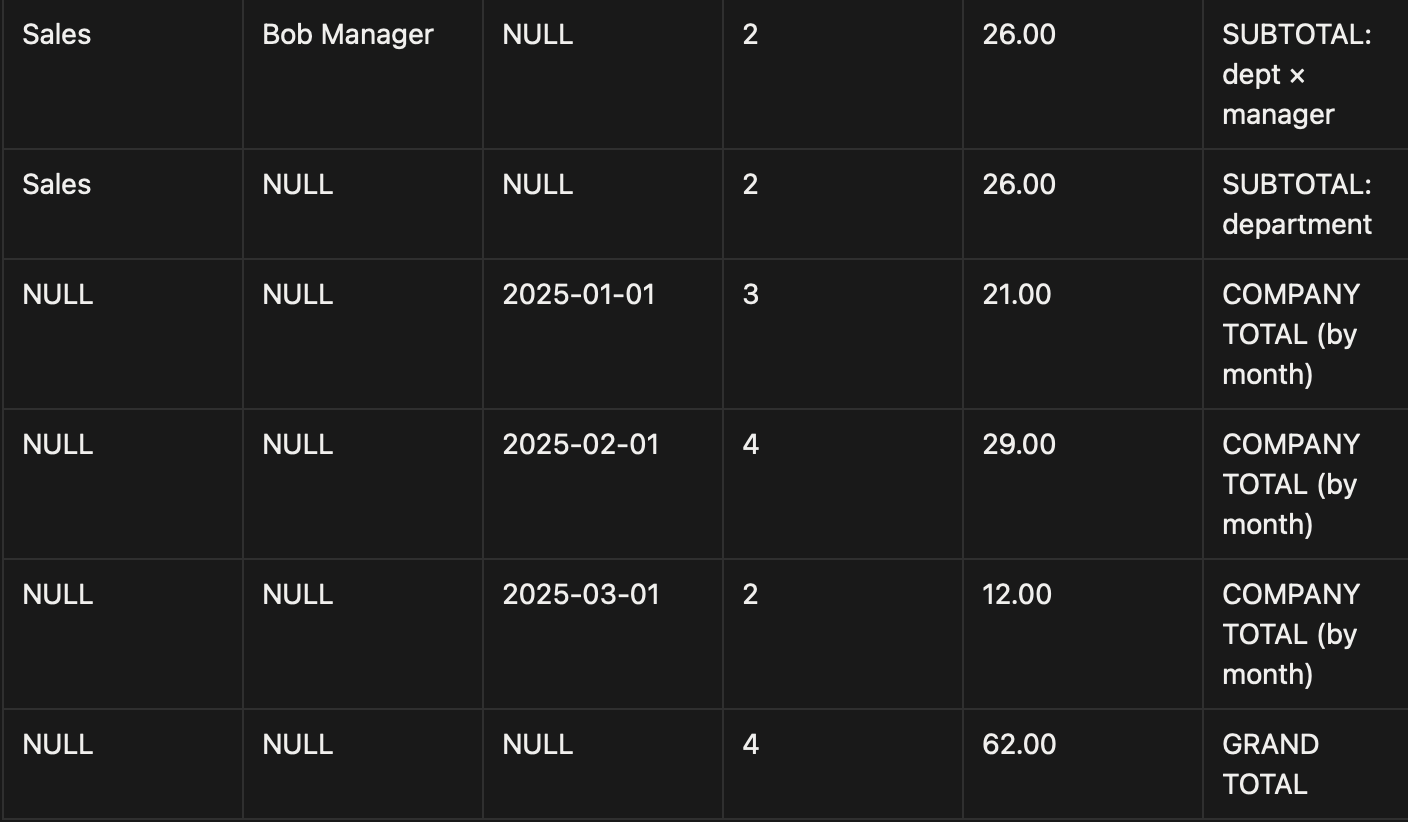
Get manager subtotals, department subtotals, company totals, all in one result
Assumed tables (map to your schema):
employees(employee_id, full_name, manager_id, department)work_log(employee_id, work_date)one row per day an employee did work (or any activity event)
Query:

Output:
7. “Challenges & pro tips”
1. Performance pitfalls:
Queries with self-joins, grouping sets, and rollups can scan huge volumes of data, making them slow and resource-intensive on large datasets.
2. Aggregate placeholders in rollups and grouping sets:
When you use ROLLUP or GROUPING SETS, SQL adds extra rows for subtotals and grand totals. In those rows, the grouped columns are filled with NULL , not because the data is missing, but as a marker that this row represents an aggregate.
3. Where self-joins fall short:
Performance overhead → Joining a large table to itself often doubles the data scanned and can make queries very slow.
Complexity → Queries become harder to read and maintain, especially with multiple conditions across the same table.
Scalability issues → On very large datasets, self-joins may time out or require excessive compute compared to equivalent window function solutions.
Pro tips :
1. Speed up queries
Summarize data first (like user–month).
Add indexes on important columns.
Only check key retention periods (Month+1, Month+2).
2. Read totals clearly
Use
GROUPING()to know which rows are subtotals.Change
NULLs into labels like ALL MONTHS or ALL YEARS.
3. Use window functions
Try
LAG,LEAD, orROW_NUMBERinstead of self-joins.They are faster, cleaner, and scale better.
8. The big picture: why It’s useful
At the end of the blog, ROLLUP and GROUPING SETS aren’t obscure SQL tricks, they’re shortcuts to thinking and working like an analyst. They turn three or four repetitive queries into one clear, maintainable query that scales with your questions. Fewer queries mean fewer errors, faster answers, and cleaner code.
So here’s the takeaway:
Next time you catch yourself writing multiple GROUP BY queries in a row, stop and ask, could this be one query with ROLLUP or GROUPING SETS?